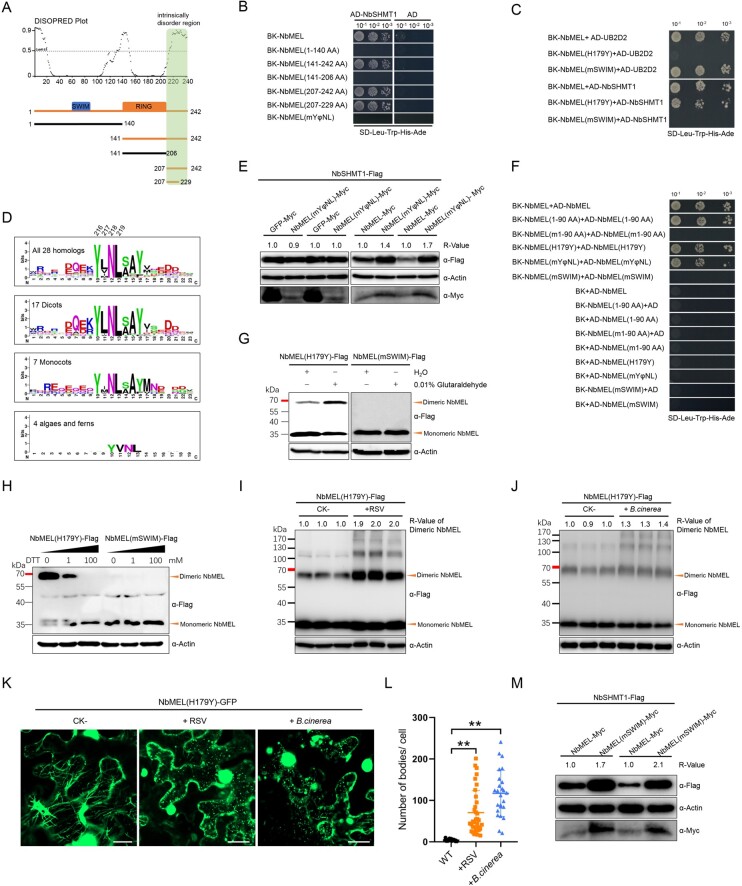
Figure 5.
NbMEL recognizes NbSHMT1 through the YφNL motif and forms homodimers dependent on the SWIM domain. A, Intrinsically disordered region in NbMEL predicted by DISOPRED 3 and schematic representation of NbMEL truncated mutants. Green box indicates the NbMEL C-terminal intrinsically disordered region interacting with NbSHMT1. Black thick lines represent mutants that are unable to interact with NbSHMT1; orange thick lines represent mutants that are able to interact with substrates. B, Interaction of NbMEL, its truncated or point mutants with NbSHMT1 tested by Y2H assay. C, Interaction of NbMEL, NbMEL(mSWIM), NbMEL(H179Y) with NbSHMT1 or UB2D2 tested by Y2H assay. D, Sequence conservation of NbMEL C-terminal 23 aa region constructed from 28 MEL homologs and drawn by WebLogo. E, NbSHMT1-Flag in vivo accumulation assay when it was co-expressed with NbMEL, NbMEL(mYφNL) or GFP (control) by agroinfiltration in N. benthamiana leaves. Actin was used as a loading control. F, Y2H assay detection of the self-interaction of NbMEL, its truncated or point mutants. G, Agrobacterium-mediated expressed NbMEL(H179Y)-Flag forms homodimer but that of NbMEL(mSWIM)-Flag was in monomeric form in vivo. Orange triangles indicate the homodimeric or monomeric forms of NbMEL. The chemical cross-linker glutaraldehyde (0.01%) was infiltrated to N. benthamiana leaves 2 h before samples were harvested. Actin was used as a loading control. H, The reducing agent DTT breaks homodimerization of NbMEL(H179Y)-Flag expressed by agroinfiltration in N. benthamiana leaves. The supernatant of total protein extracts was treated with 0–100 mM DTT at 25°C for 20 min. Black triangles above the band indicate increasing amounts of reducing agent DTT from 0 to 100 mM. Orange triangles indicate the dimeric or monomeric form of NbMEL(H179Y). I, In vivo accumulation assay of NbMEL(H179Y)-Flag expressed by agroinfiltration in mock (CK-) or RSV-infected N. benthamiana leaves. J, In vivo accumulation assay of NbMEL(H179Y)-Flag expressed by agroinfiltration in mock (CK-) or B. cinerea infected N. benthamiana leaves. K, Subcellular localization of NbMEL(H179Y)-GFP expressed by agroinfiltration in mock (CK-), RSV infected and B. cinerea inoculated N. benthamiana leaves. Confocal images were taken at 48 hpi. Bar: 20 μm. L, Number of NbMEL(H179Y)-GFP fluorescence bodies in mock, RSV infected and B. cinerea inoculated N. benthamiana epidermal cells. Data are means ± sd (n = 25). Asterisks mark significant differences according to two-tailed Student’s t test, **P < 0.01. In (E) and (I–J), the bands in immunoblot were quantified and the relative intensities (R-value) are shown above the band. M, NbSHMT1-Flag in vivo accumulation assay when it was co-expressed with NbMEL or NbMEL(mSWIM) by agroinfiltration in N. benthamiana leaves. Actin was used as a loading control. All the experiments were performed 3 times with similar results.

