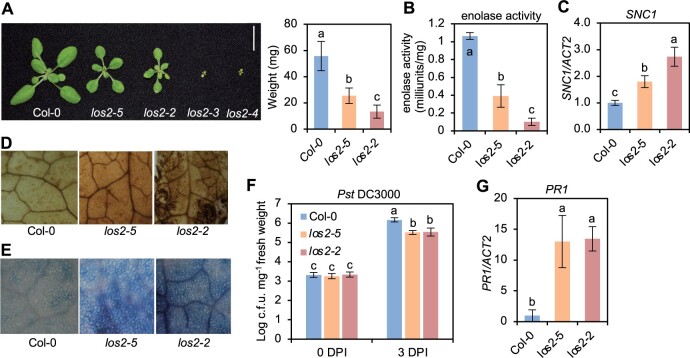
Figure 2.
The los2 mutants display constitutively activated immune responses. A, Morphology of Col-0, los2-5, los2-2, los2-3, and los2-4 mutants, and quantification of weight of Col-0, los2-5, and los2-2. Scale bar = 1 cm. N = 20. B–G, Enolase activity (B), analysis of SNC1 gene expression (C), DAB staining (D), trypan blue staining (E), growth of bacterial pathogen Pst DC3000 (F), and analysis of PR1 gene expression (G) in 2-week-old WT, los2-5, and los2-2. Four biological replicates were performed for (B). Three biological replicates were performed for (C) and (G). Six biological replicates were performed for (F). Error bars represent sd. Different letters indicate significant difference tested by one-way ANOVA/Duncan’s multiple range test via R 3.6.3 with “agricolae” package, P < 0.05.

