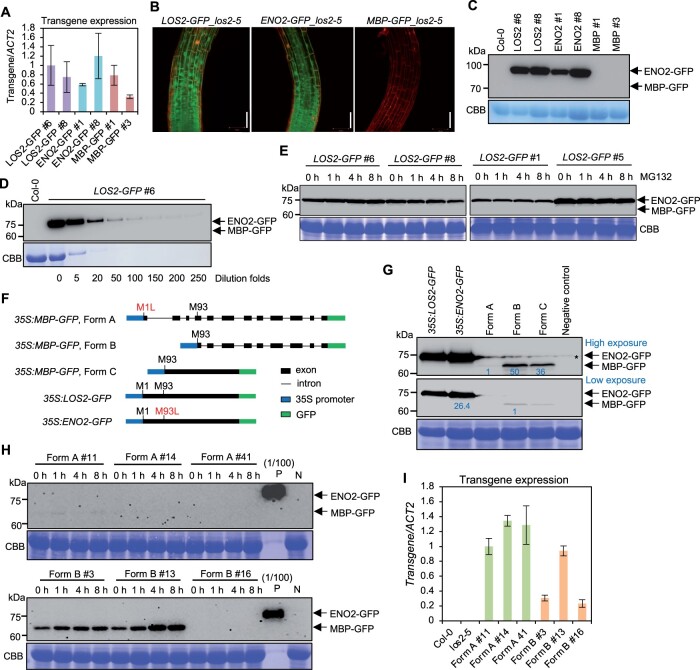
Figure 8.
Endogenous MBP cannot be detected in Arabidopsis under the native LOS2 gene context. A, Analysis of transgene expression in complementation lines of LOS2-GFP (#6 and #8), ENO2-GFP (#1 and #8), and MBP-GFP (#1 and #3). The expression of LOS2-GFP #6 was set to 1. B, Confocal microscopy showing the expression pattern of LOS2-GFP, ENO2-GFP, and MBP-GFP in Arabidopsis root treated with propidium iodide. Scale bar = 50 μm. C, Immunoblot detecting the fusion protein by anti-GFP antibody in complementation lines of LOS2-GFP (#6 and #8), ENO2-GFP (#1 and #8), and MBP-GFP (#1 and #3) in los2-5 background. Col-0 was used as a negative control. D, Immunoblot of LOS2-GFP #6 using anti-GFP antibody. The number under each band indicated the dilution folds of LOS2-GFP #6 total proteins. Col-0 was used as a negative control. E, Immunoblot detecting ENO2-GFP and MBP-GFP proteins by anti-GFP antibody in four independent lines of LOS2-GFP (#6, #8, #1, and #5) after 50-μM MG132 treatment for 1, 4, and 8 h. F, Simplified gene structures of fusion proteins LOS2-GFP, ENO2-GFP, and three forms of MBP-GFP all of which were driven by 35S promoter. CDS of LOS2 and ENO2 were fused with GFP to form LOS2-GFP and ENO2-GFP. LOS2 genomic DNA with the first translation initiation site mutated (M1L) was fused with GFP to generate MBP-GFP (Form A) while LOS2 genomic DNA lacking the N-terminal sequence was fused with GFP for MBP-GFP (Form B). MBP-GFP (Form C) contains MBP CDS fused with GFP. G, Immunoblot detecting the fusion proteins expressed in N. benthamiana using anti-GFP antibody. Negative control was a sample without infiltration. Asterisk indicates a nonspecific band detected in the samples. Protein levels were quantified by ImageJ. For the upper, proteins from Forms B and C were normalized to proteins from Form A; for the lower, ENO2-GFP was normalized to proteins from Form B. Blue letters indicated the fold changes. H, Immunoblot of MBP proteins from transgenic plants of Form A (#11, #14, and #41) and Form B (#3, #13, and #16) treated with 50 μM MG132 for 1, 4, and 8 h. Each form had two representative lines in which MBP could be detected (#11 and #14 from Form A; #3 and #13 from Form B) and one representative line in which MBP could not be detected (#41 from Form A and #16 from Form B) under normal conditions. “(1/100) P,” positive control sample from pLOS2:LOS2:GFP #6 diluted 100 times. The same amounts of protein from positive control and negative control samples were loaded for the upper and lower blots. I, Transgene expression of three independent lines of 35S:MBP (Form A):GFP and 35S:MBP (Form B):GFP. The expression of Form A #11 was set to “1.” Three biological replicates were performed for (A) and (I), and error bars represented sd. For transgene expression analysis, the forward primer targeted LOS2 sequences and the reverse primer targeted GFP sequences. This same primer pair was able to amplify each of the three transgenes. Arrows in (C–E) and (G and H) indicate the expected size of ENO2(enolase)-GFP and MBP-GFP fusion proteins. CBB, Coomassie brilliant blue; L, leucine; M, methionine; N, negative control sample from Col-0.

