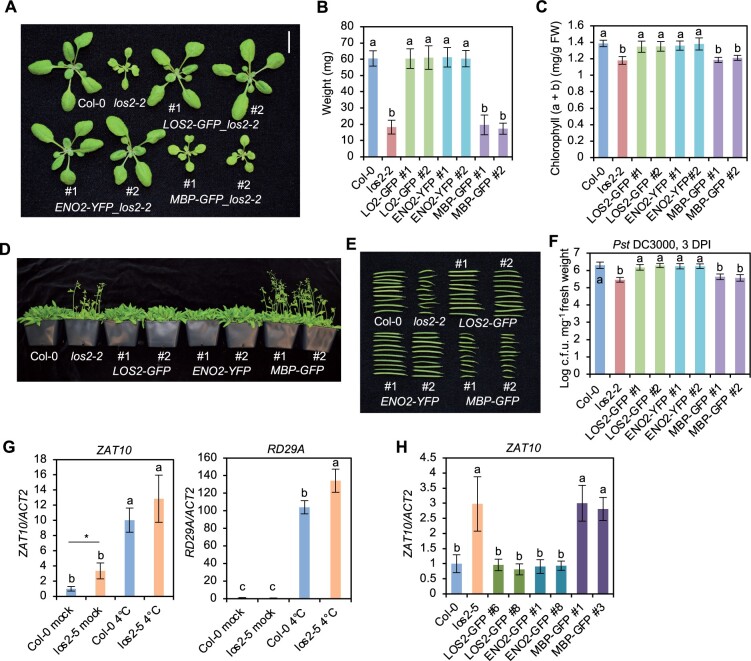
Figure 9.
ENO2, but not MBP, rescues developmental defects and ZAT10 gene expression in the los2 mutant. A–F, Morphology (A), weight (B), chlorophyll amount (C), flowering (D), silique (E), and Pst DC3000 growth assay (F) of 2-week-old Col-0, los2-2 and two representative transgenic lines of pLOS2:LOS2:GFP (LOS2-GFP), pLOS2:ENO2:YFP (ENO2-YFP) and pLOS2:MBP:GFP (MBP-GFP) in los2-2 background. Scale bar in (A) is 1 cm and N = 20 for (B). G, Analysis of ZAT10 and RD29A gene expression in Col-0 WT and los2-5 mutant before (mock) and after 4°C treatment for 24 h (4°C). H, Analysis of ZAT10 gene expression in Col-0 WT, los2-5 mutant and complementation lines of LOS2-GFP (#6 and #8), ENO2-GFP (#1 and #8) and MBP-GFP (#1 and #3) in los2-5 background under normal condition. Four and six biological replicates were performed for (C) and (F), respectively. Three biological replicates were performed for (G) and (H). Different letters indicate significant difference tested by one-way ANOVA/Duncan’s multiple range test via R 3.6.3 with “agricolae” package, P < 0.05. Asterisk indicates a significant difference tested by Student’s t test, P < 0.05. FW, fresh weight.

