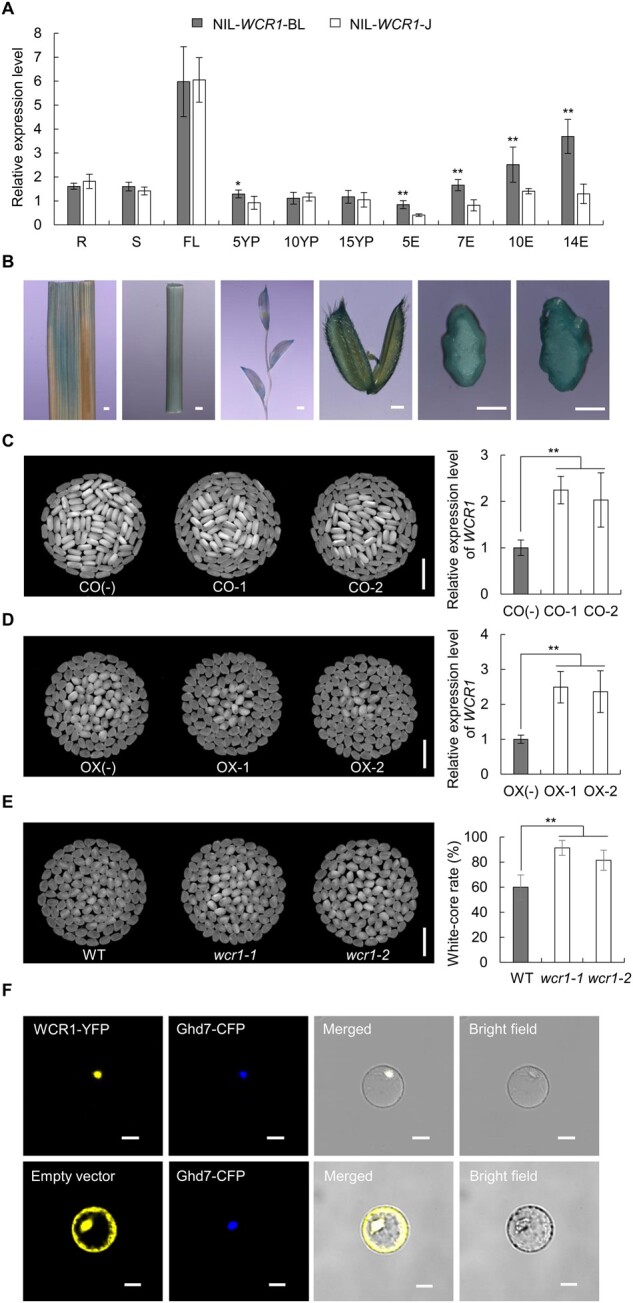
Figure 2.

Expression patterns, transgenic verification, and subcellular localization of WCR1. A, Spatiotemporal expression patterns of WCR1 in the NILs. R, S, and FL: roots, stems and flag leaves at the heading stage; 5YP, 10YP, and 15YP: young panicles 5, 10, and 15 cm long; 5E, 7E, 10E, and 14E: grain endosperm at 5, 7, 10, and 14 DAF. Samples were obtained from at least five different plants. Significant differences were based on two-tailed t tests (n = 5), *P ≤ 0.05, **P ≤ 0.01. Error bars, sem. B, Expression analysis of WCR1 by GUS staining. From left to right, photographs of a flag leaf, stem, young panicle, glume, and transverse sections of caryopsis from plants harboring GUS driven by the WCR1 promoter at 7 DAF and 10 DAF. Scale bars, 1 mm. C and D, Grain chalkiness and expression level of WCR1 in CO and OX lines. CO-1/CO-2 and OX-1/OX-2 refer to positive complementation and OX lines, respectively. CO(−) and OX(−) represent transgene-negative lines. Scale bars, 10 mm. Significant differences were based on two-tailed t tests (n = 4), **P ≤ 0.01. Error bars, sem. E, Grain chalkiness of KO lines. wcr1-1 and wcr1-2 represent homozygous mutants with a 27- and 1-bp deletion in the third exon of WCR1, respectively. Scale bars, 10 mm. Significant differences were based on two-tailed t tests (n = 25), **P ≤ 0.01. Error bars, sem. F, WCR1-YFP and Ghd7-CFP (nucleus marker) co-localize in the nucleus. The empty vector pM999-YFP was used as a negative control. Scale bars, 20 μm.
