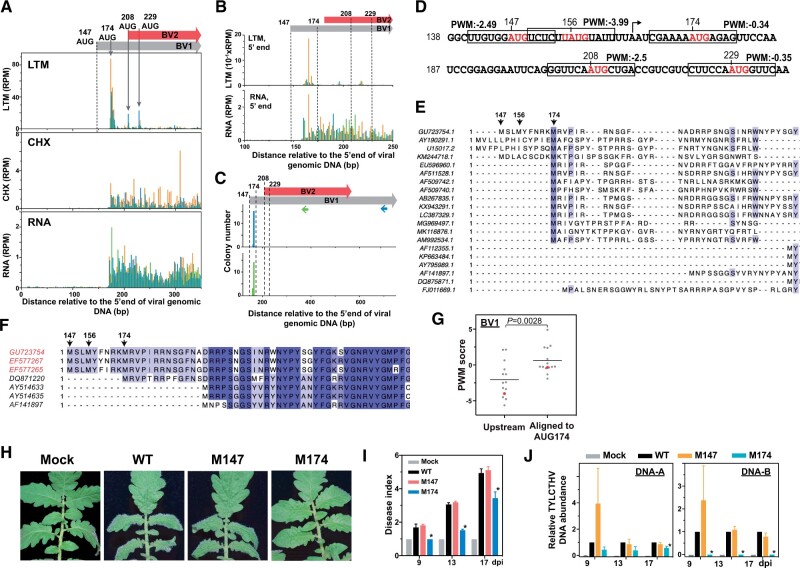
Figure 4.
A downstream TIS is used for BV1 expression and is required for virus infection. A, As described in Figure 1, A–C, but for the LTM, CHX and RNA read densities along the plus strand of the BV1 and BV2 genic regions. The annotated TIS (AUG147; dashed line) and one downstream TIS (AUG174) of BV1 and two TISs (AUG208 and AUG229) of BV2 supported by LTM signals (gray arrows) are indicated. B, As indicated in (A), but for the positional distributions of the 5′ ends of LTM and RNA reads. C, The positional distribution of the 5′ ends of the BV1 and BV2 transcripts (gray and red boxes; top panel) as described in Figure 2A. Two sets of results (middle and bottom panels) generated from two distinct primers targeting BV1 (blue arrow in top panel) and both BV1 and BV2 (green arrow in top panel) are shown. D, As described in Figure 2G, but for PWM scores of AUG sites from the region ranging from 138 to 237 nt. E and F, As described in Figure 2J, but for the amino acid sequence alignments of annotated BV1 genes among 20 begomoviruses (E) and TYLCTHV isolates found in Taiwan (red) and in Thailand (black) (F). For all begomoviruses, see Supplemental File S2. G, As described in Figure 2H, but for the PWM scores of AUG sites of begomovirses that were aligned to AUG174 of TYLCTHV DNA-B molecule and the associated nearest upstream AUG sites. Red: the AUG174 site of TYLCTHV DNA-B and its associated nearest upstream AUG sites. H–J, As described in Figure 3, A–C, but for the phenotypes (H), disease indexes (I), and viral DNA abundances (J) of tomato plants infected with infectious clones with WT sequences, with mutations at the annotated TIS (M147ATG→GCG) or downstream TIS (M174ATG→GCG), and without viral DNAs (Mock). Photographs were taken at 17 dpi. The annotated TIS at position 147, the in vivo TISs at positions 174, 208, and 229 and the AUG site at position 156 that is identified based on sequences are indicated.

