
Fig. 3. Intratumoral ensemble analysis of GBM.
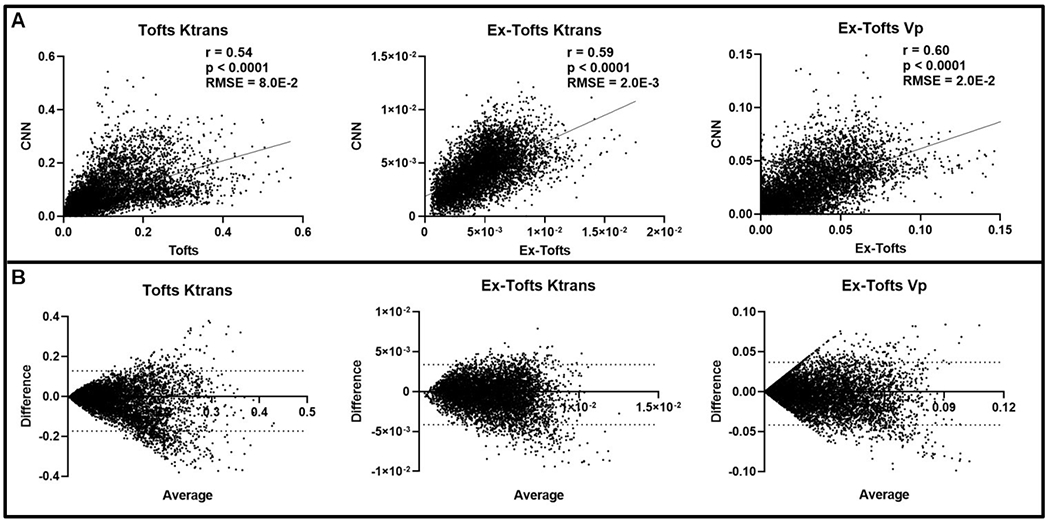
(A) Pixel-by-pixel data (n = 7606) of intratumoral regions were plotted, revealing a significant linear correlation for Ktrans and Vp between CNN and target PK models (p < 0.0001). Low RMSEs were found between the target PK models and the CNN for all three parameters (RMSE < Target PK parameter SD). (B) Bland-Altman plots of PK parameters were generated with dashed lines corresponding to the upper and lower 95% confidence intervals.