Figure 3.
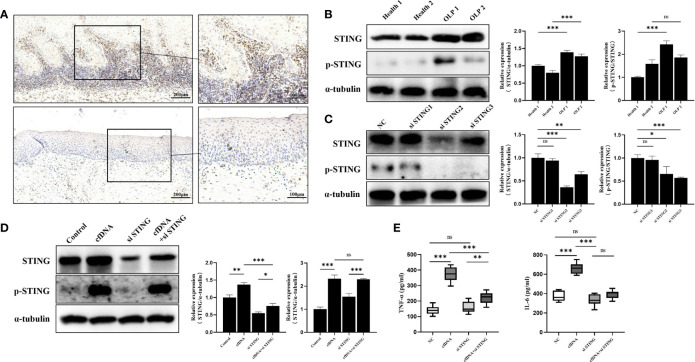
cfDNA-OLP Promoted Inflammation by Activating STING. (A) STING expression in OLP tissues was visualized by immunohistochemistry (IHC) staining. Scale bar: 200 and 100 μm. (B) The expression of STING in healthy tissues (n=2) and OLP tissues (n=2) was assessed by western blotting. (C) THP-1 macrophages were transfected with anti-STING siRNA for 48 h. The protein levels of STING and p-STING was detected by western blotting. (D) Western blotting was performed to measure the protein levels of STING and p-STING in STING-knockdown THP-1 macrophages incubated with cfDNA-OLP for 24 h. (E) ELISA was performed to measure the levels of TNF-α and IL-6 in the supernatants of STING-knockdown THP-1 macrophages treated with cfDNA-OLP for 24 h. The data are mean ± SEM (*P<0.05, **P<0.01, ***P<0.001). ns, not significant.

