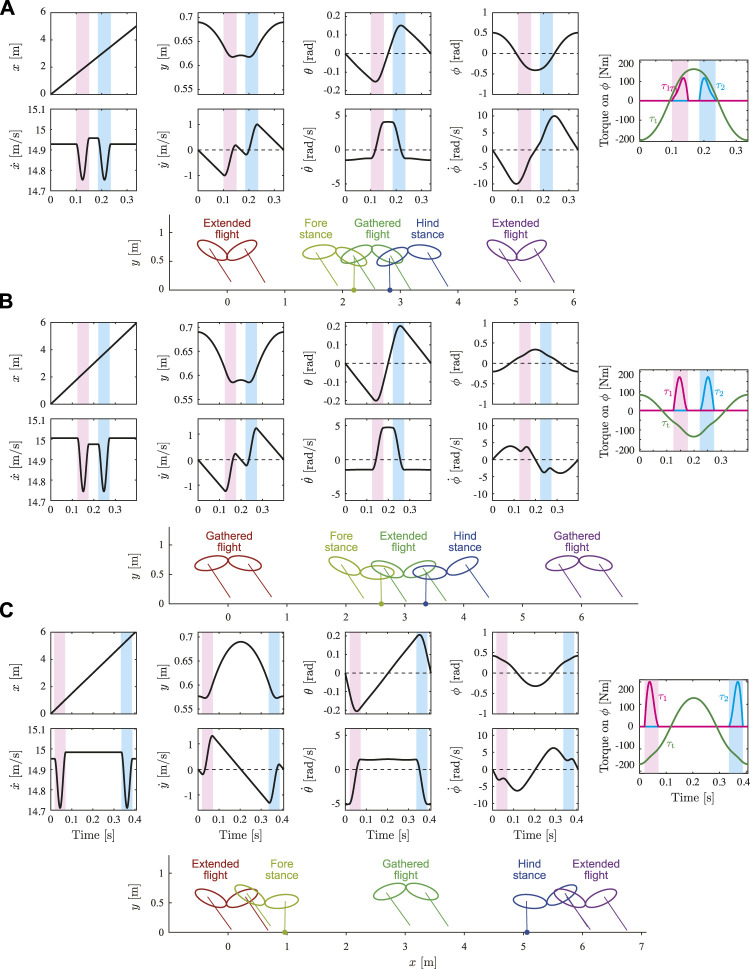
FIGURE 6.
Time profiles and snapshots of typical solutions for y* = 0.69 m. Snapshots illustrate state at mid-stance or mid-flight in each phase (see Supplementary Movie). (A) Solution in Branch 1 (Type EG, a in Figure 5) and (B) solution in Branch 2 (Type GE, b in Figure 5) for rad/s. (C) Solution in Branch 2 (Type EG, c in Figure 5) for rad/s. Red and blue shaded areas indicate stance phase of foreleg and hind-leg, respectively.

