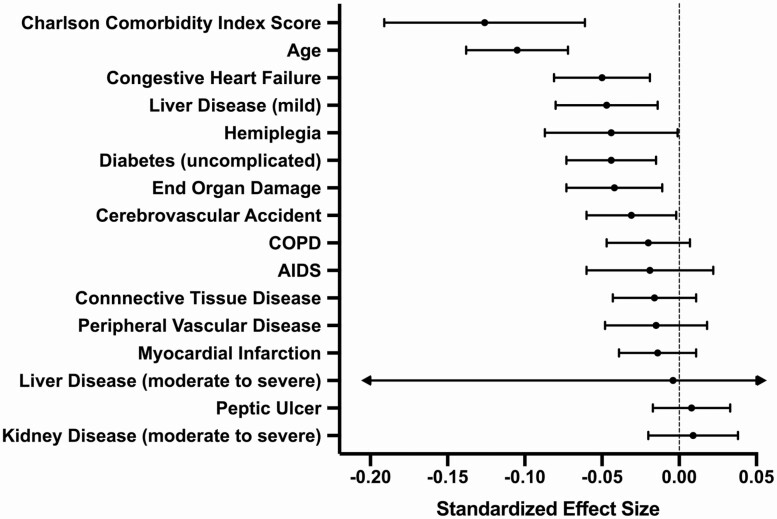
Figure 2.
Forest plot showing the relative effect sizes of the predictor variables, including individual components of the Charlson index, as related to the outcome of neurocognitive slopes of decline (change over time). The overall Charlson score was the strongest predictor. Each of the predictors below is person-averaged (ie, at the between-person level). These mixed-effect models covary for demographics (age, sex, education, and race/ethnicity). Abbreviation: COPD, chronic obstructive pulmonary disease.

