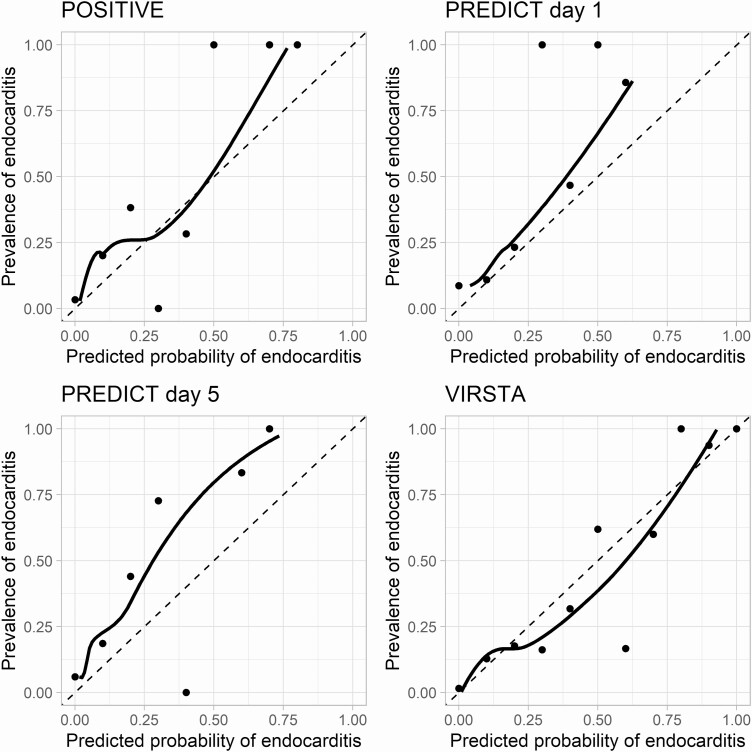
Figure 2.
Calibration curves of the POSITIVE, PREDICT, and VIRSTA scores. The points show the relation between predicted probability of Staphylococcus aureus infective endocarditis for each decile of predicted probability of endocarditis as calculated using the respective scores. The solid line is the Loess fit through the points. The dashed line represents perfect calibration.

