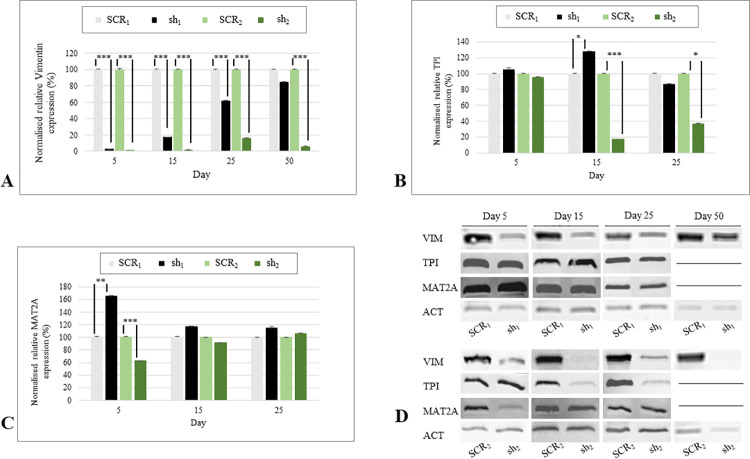
Fig 5. mRNA and protein expression of VIM, TPI and MAT2A in knockdown cells.
A. Median and standard error of relative VIM mRNA expression of sh1, SCR1, sh2, SCR2. VIM was significantly downregulated in sh1 and sh2 at each investigation day (p<0.001), except of day 50 in sh1. Statistical analysis was carried out using Mann–Whitney U test for unpaired data. B. Relative mRNA expression of TPI of sh1, SCR1, sh2, SCR2. TPI was significantly upregulated in sh1 at day 15 (p<0.05) and downregulated in sh2 at day 15 (p<0.001), and 25 (p<0.05). Statistical analysis was carried out using Mann–Whitney U test for unpaired data. C. Median and standard error of relative MAT2A mRNA expression of sh1, SCR1, sh2, SCR2. MAT2A was significantly upregulated in sh1 (p<0.01), and downregulated in sh2 at day 5 (p<0.001). Statistical analysis was carried out using Mann–Whitney U test for unpaired data. D. Western blot analysis of VIM, TPI and MAT2A in sh1, SCR1, sh2, SCR2 at day 5, 15, 25. ACT was used as internal control. *p<0.05, **p<0.01, ***p<0.001.

