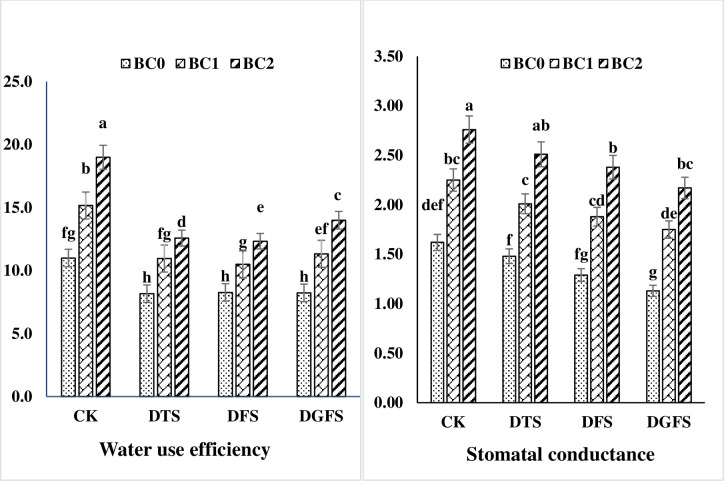
Fig 1. Water use efficiency (%) and stomatal conductance (m mol-2 s-1) contents affected by biochar application under drought stress at critical growth stages of wheat.
CK, DTS, DFS and DGFS indicates control, drought at tillering, flowering and grain filling stages respectively. BC0, BC1 and BC2 indicates control, 3% and 5% biochar respectively. Error bars indicates standard error (n = 4).

