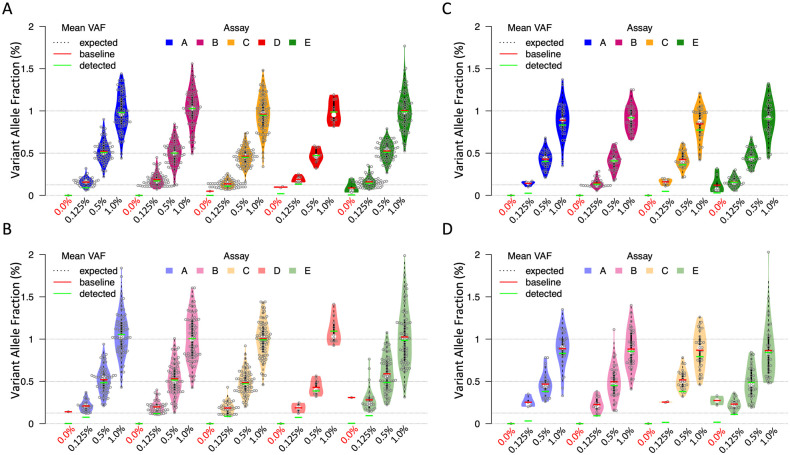
Fig 3. Quantification and accuracy of average VAF.
Average VAF (green dash) was calculated using individual reported VAFs of all the reference mutations including 0% VAF values of non-detected mutations. The average VAF of only detected mutations (red dash) was also included for information purpose; the expected VAF is represented at 0%, 0.125%, 0.5% and 1% (dotted horizontal line). A, Distribution of the observed VAFs of the reference mutations in sample set one at 0 to 1% VAF and input of 30 ng (assay A and B) or 50 ng DNA (assay C, D, E); false positive mutations were detected by assay D (red) and assay E (green) from negative samples (violin plots at 0% VAF). B, Similar analysis for sample set one with 10 ng DNA input; average of observed VAFs was consistent with expected values for all five assays. False positive mutations were detected by assay A (light blue) and assay E (light green) from negative samples. C, Similar analysis for sample set two with 30 ng (assay A and B) or 50 ng (assay C, D, E) DNA input; average VAFs of assay B and assay E were closer to the expected values. Assay E (green) detected false positive mutations in negative samples. D, Similar analysis for sample set two with 10 ng DNA input; average VAFs of assay B and assay E were closer to the expected values. Assay E (green) detected false positive mutations in negative samples.

