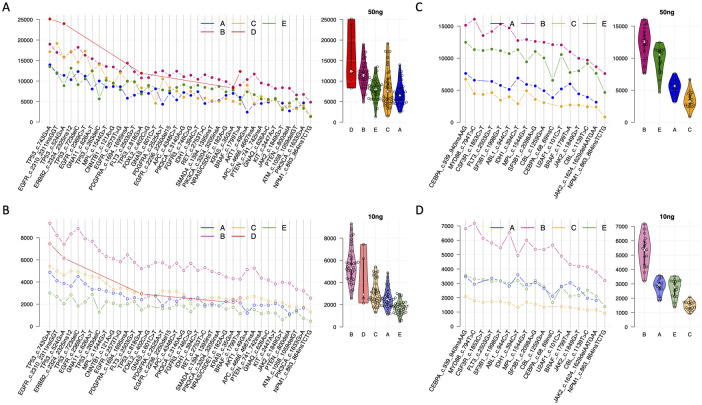
Fig 4. Depth of coverage and heterogeneity of the mutation loci. x-axis, mutation loci in sample set one or two; y-axis, depth of coverage after UMI consolidation.
A, Depth of coverage of the mutation loci (line charts, left) and distribution (violin charts, right) for sample set one with 30 ng (assay A and B) or 50 ng (assay C, D, E). Assay B (pink) and assay D (red) showed higher depth of coverage than the other assays. B, Similar analysis for sample set one with 10 ng DNA input. Assay B has higher depth of coverage (light pink line, left) than the other assays across all the mutation loci and highest average coverage depth (light pink violin plot, right). C and D, Similar analysis for sample set two with 30 ng (assay A and B) or 50 ng (assay C, D, E) or 10 ng DNA input. assay B (dark or light pink lines, left) has higher depth of coverage than other assays across all the mutation loci and the highest average of coverage depth (dark or light pink violin plots, right).

