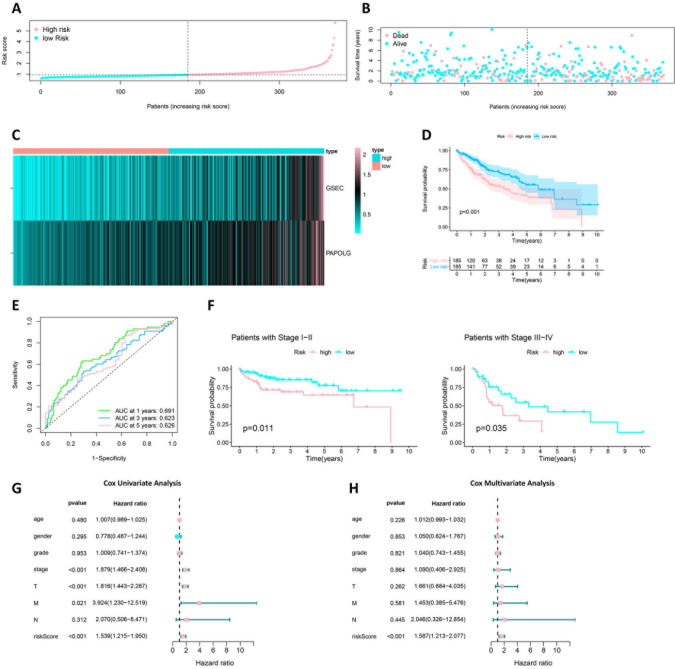
Fig 9. Prognostic value of risk model for GSEC and PAPOLG.
(A) Risk curve for each sample based on risk value. (B) Scatter plot for each sample based on risk value. (C) Heat map showing expression of GSEC and PAPOLG in high and low risk. (D) Survival analysis of patients with high-risk HCC and low risk HCC based on risk model. (E) Risk model at 1 year (AUC = 0.691), 2-year (AUC = 0.623), and 3-year (AUC = 0.626) ROC curves. (F) Survival curves of HCC patients with TNM stages I-II (n = 162) and III-IV (n = 72). (G) Cox single-factor regression analysis of the risk model. (H) Cox multi-factor regression analysis of the risk model.

