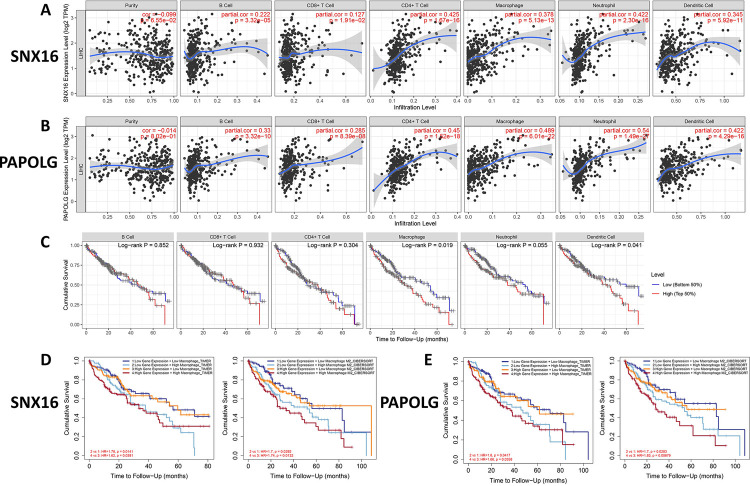
Fig 11. Correlation analysis of SNX16 and PAPOLG expression with immune infiltration.
Correlation of SNX16 (A) and PAPOLG (B) expression with the level of immune cell infiltration. (C) Survival curves to analyze the relationship between six types of immune cell infiltration and overall survival of patients with HCC. Kaplan-Meier survival curves to analyze the effect of SNX16 (D) and PAPOLG (E) expression with macrophages and M2 macrophages on the overall survival of patients with HCC.

