Fig. 3.

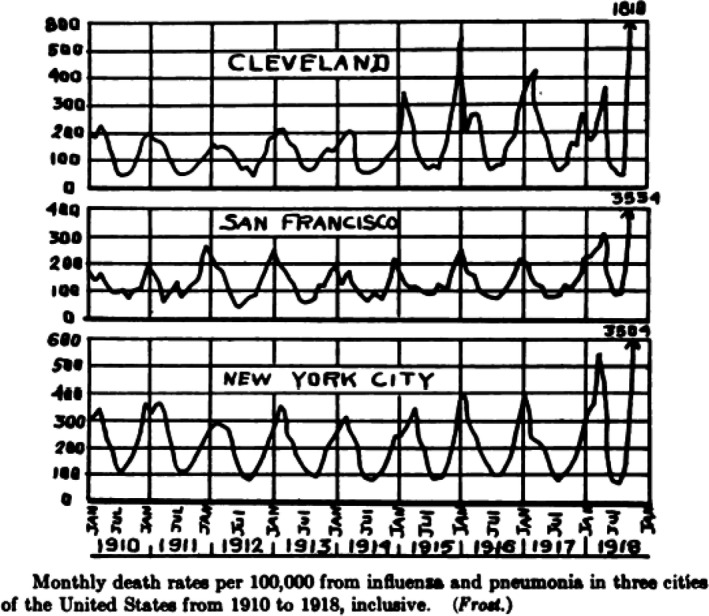
Monthly death rate per 100 000 for three US cities between 1910 and 1918. The fall 1918 peak is not to scale and exceeds that of the preceding years by more than a factor of 10 for New York. Source: Vaughan (1921).

Monthly death rate per 100 000 for three US cities between 1910 and 1918. The fall 1918 peak is not to scale and exceeds that of the preceding years by more than a factor of 10 for New York. Source: Vaughan (1921).