. 2020 Feb 11;10(11):6306–6314. doi: 10.1039/c9ra10385f

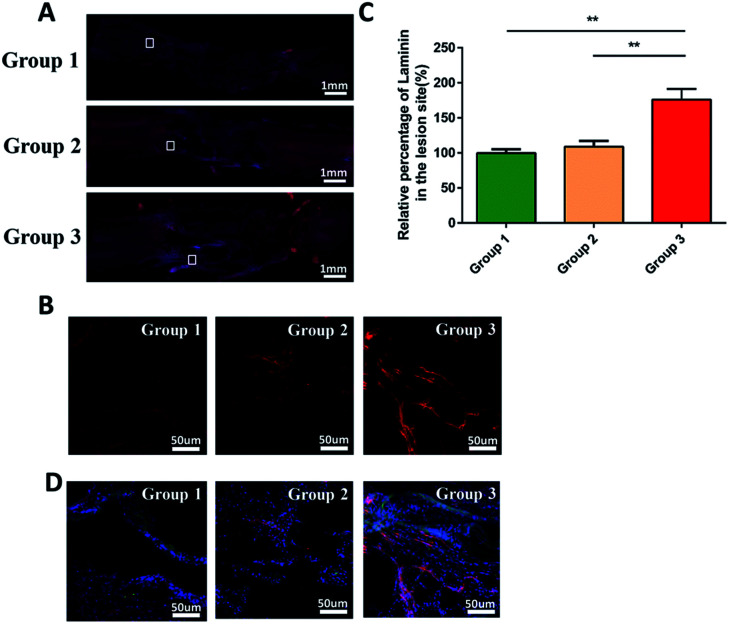
Fig. 7. Immunofluorescence staining to evaluate the production of laminin at the injury site 8 weeks after SCI. (A) Immunofluorenscence staining for the longitudinal sections at low magnification; (B) is an enlarged view of local tissue stained with immunofluorenscence: laminin (red, a supportive substrate marker). (C) Quantification of the percentages of laminin in the lesion area of the rats in each group. Data presented as mean ± standard deviation (n = 3 for each group). p values in (C) were determined by one-way analysis of variance (ANOVA) followed by Tukey's post hoc test, * denotes p < 0.05, ** denotes p < 0.01. (D) Immunofluorescence staining images: MAP2 (blue, a neuronal marker), laminin (red, a supportive substrate marker). They are close to each other in position.

Fig. 7