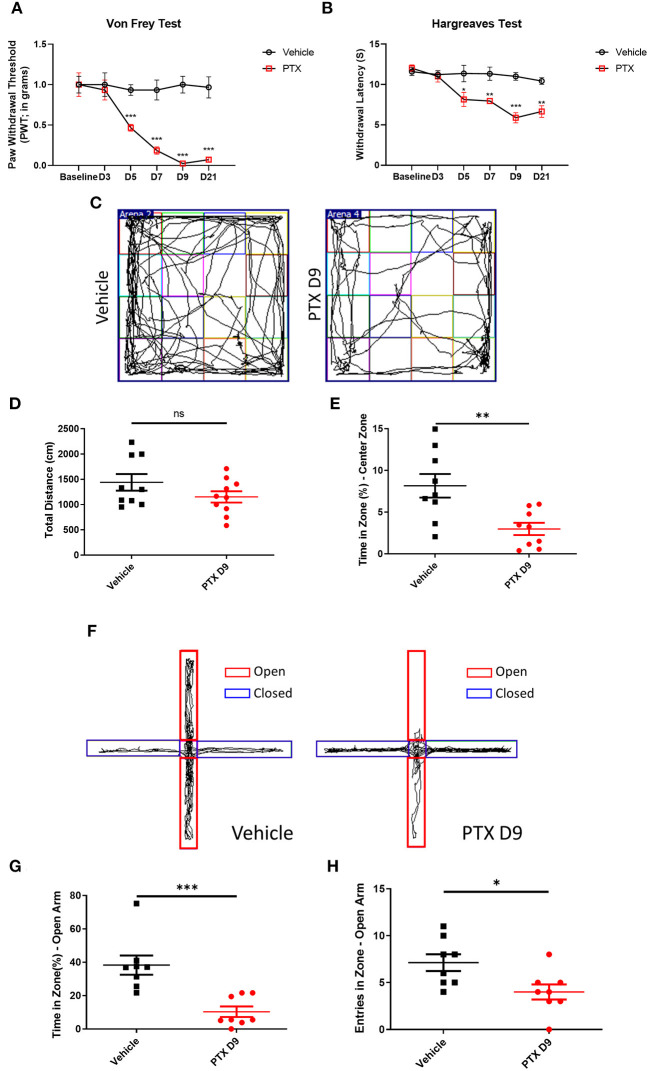
Figure 1.
Establishment of paclitaxel chemotherapy pain model. (A,B) The behavioral changes of paw withdrawal thresholds and paw withdrawal latencies in the vehicle group and paclitaxel group at different time. (C) Open field test trajectory diagram of vehicle and paclitaxel groups. (D) Total distance statistics of the vehicle group and paclitaxel group. (E) The statistical results of the percentage of central area activity time in the vehicle group and paclitaxel group. (F) The trajectory diagram of the elevated plus maze test in the vehicle and paclitaxel groups. (G) Statistic results of the percentage of open arm entry time in the vehicle group and paclitaxel group. (H) Statistic results of the number of entries open arm in the vehicle group and paclitaxel group. n = 6–9, ns, no significant, *P < 0.05, **P < 0.01, ***P < 0.001.

