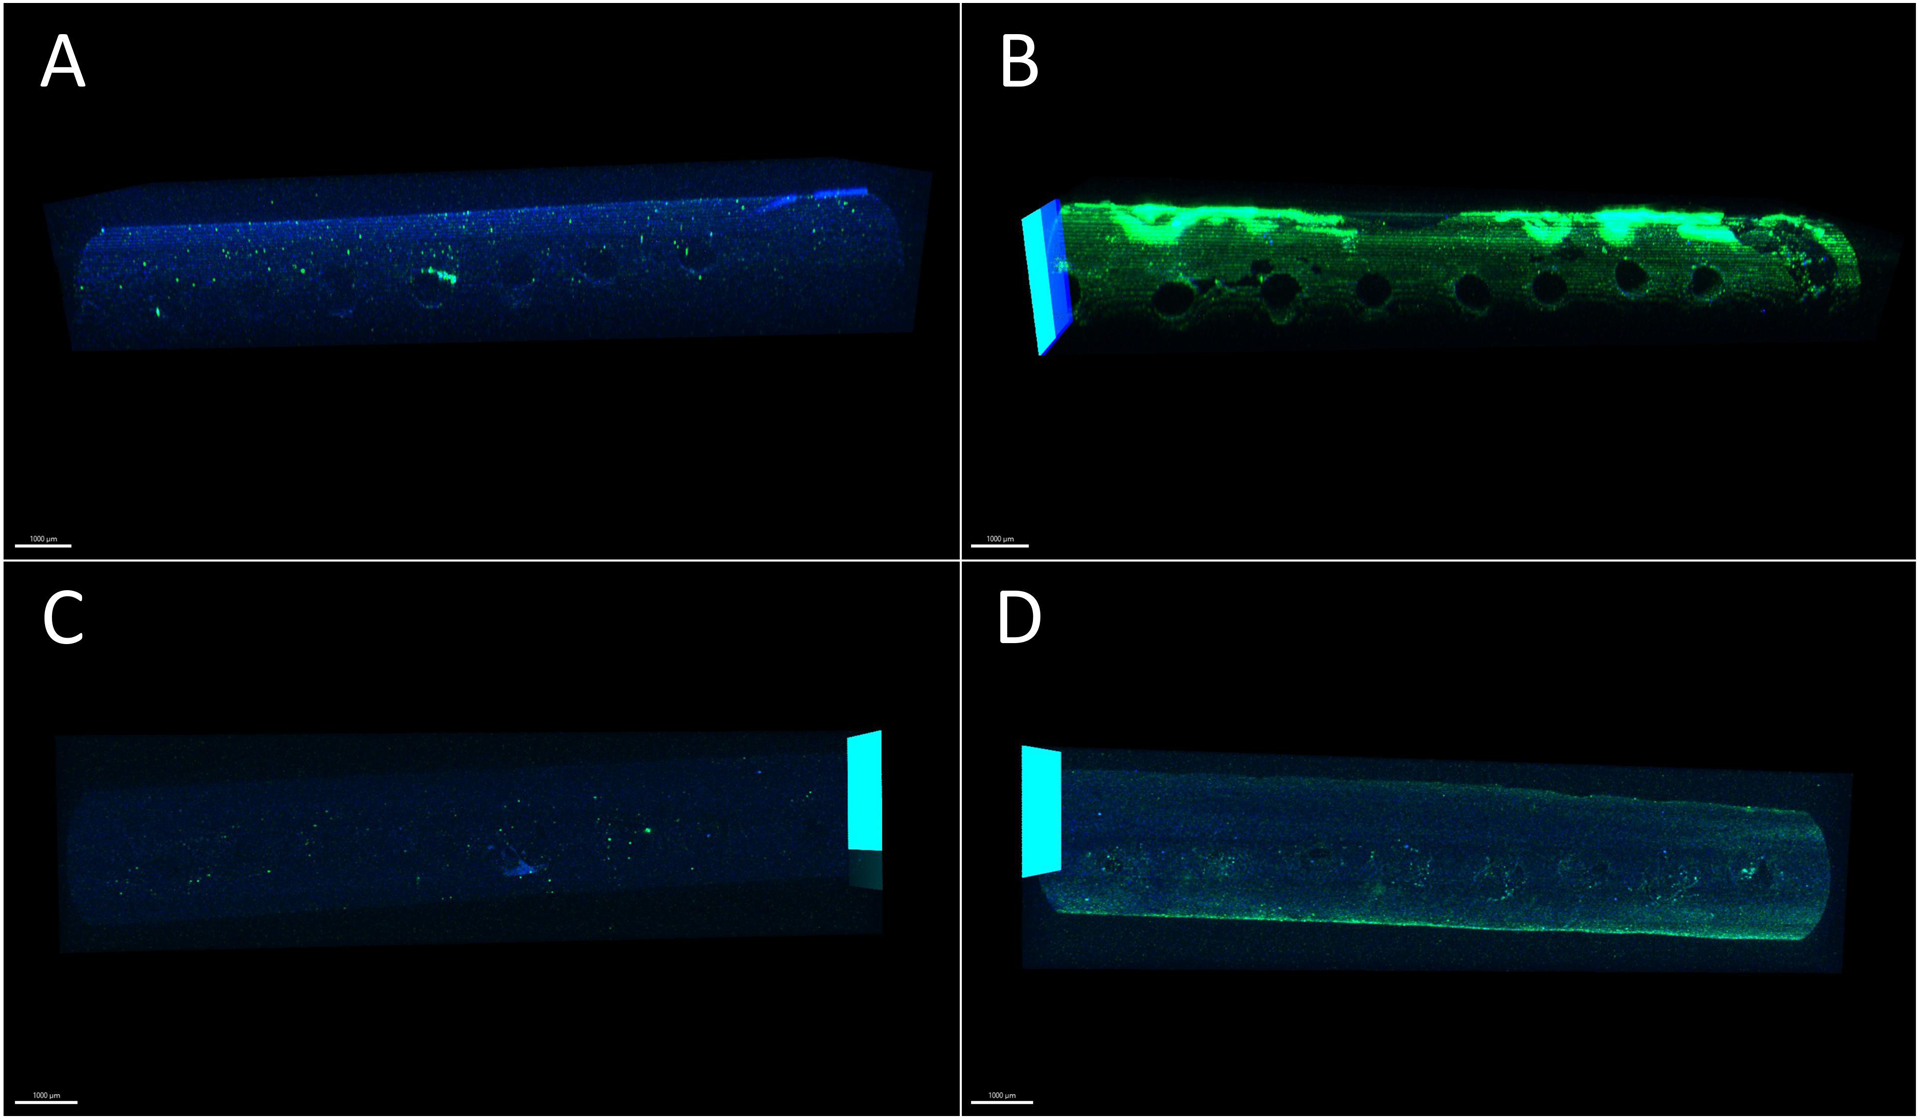
Figure 5:

Representative images of the catheter with DAPI and GFAP as blue and green shading respectively. The portions of the catheter in green represent the GFAP stain and the cytoplasm of the astrocyte, and the parts in blue represent the nuclei of the cells. These images show a representation of staining expression on the surface of the catheter. In the blood exposed sample, in (C), an over expression of GFAP was observed, seen in green. (A) Control Sample - Side Row of Holes (B) Blood Exposed Sample – Side Row of Holes (C) Control Sample – Rows of Holes in Direct Contact with Cells (D) Blood Exposed Sample – Rows of Holes in Direct Contact with Cells. Scale bar indicates 1000 μm.
