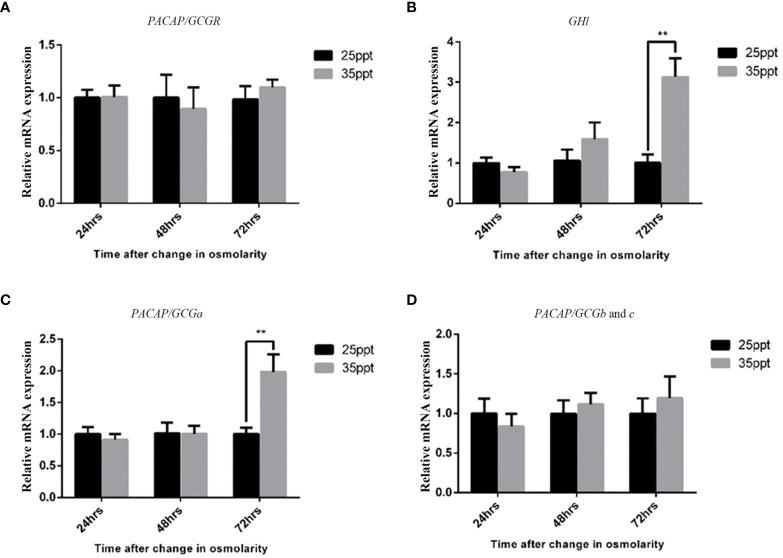
Figure 6.
Effect of high salinity challenge in the expression of the PACAP/GCG system and GHl in the head of B. belcheri. Gene expression levels of (A) PACAP/GCG-R, (B) GHl, (C) PACAP/GCGa, and (D) PACAP/GCGb and PACAP/GCGc determined by quantitative PCR and normalized using the ef1a expression as reference. Data represent the pool of samples collected from two independent experiments (n = 3/experiment) and is expressed as means ± SEM (n = 6 unpaired t-test, **p ≤ 0.01).

