. 2020 Feb 26;10(14):8291–8302. doi: 10.1039/c9ra10037g

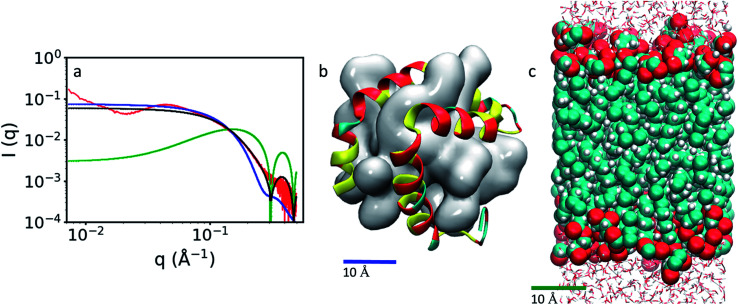
Fig. 6. (a) SAXS profiles obtained experimentally (red curve, adapted from Mahsa et al.)45 and from the MD simulations where the blue line was obtained from the GMO/LL-37 micelles, the green line from the GMO bilayer and the black line by combining the spectra of the GMO/LL-37 micelles and the bilayer. The experimental curve was obtained from a solution containing 0.5 wt% GMO and 0.5 wt% LL-37 in water. (b) GMO/LL-37 micelle obtained from the MD simulations. In this image, the GMO molecules are shown as a continuous glossy surface and LL-37 is drawn using a cartoon representation. (c) GMO bilayer shown using a vdW representation: the carbon is colored in turquois, the oxygen in red and the hydrogen in white.

Fig. 6