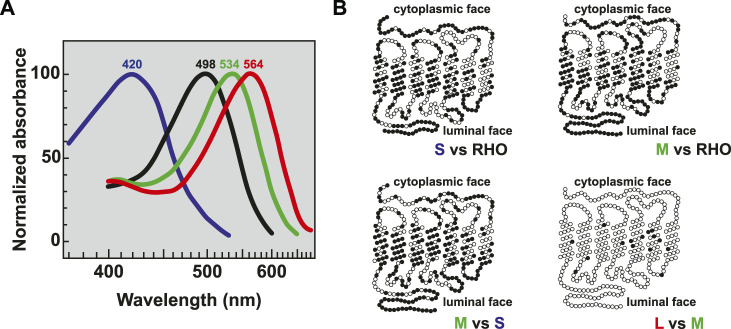
FIGURE 3.
Opsin absorption and comparative morphology. (A) Relative absorption spectra of opsins with labeled peaks for S cones (blue, 420 nm), Rods (black, 498 nm), M cones (green, 534 nm), and L cones (red, 564 nm) adapted from (Bowmaker et al., 1980). (B) Pairwise comparisons of amino acids between the visual opsin proteins adapted from (Nathans et al., 1986b). Dark circles indicate amino acid differences. Sequences were optimally aligned such that no insertions or deletions were required except for comparing the carboxy termini between the green or red and blue pigments.

