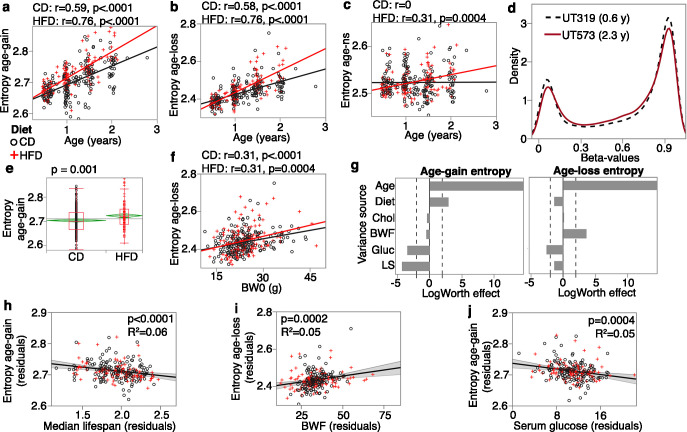
Figure 3. Entropy at age-associated CpGs.
Entropy values were calculated for the 5020 age-gain and 1523 age-loss CpGs separately. For both control diet (CD) and high-fat diet (HFD), there is a significant increase in entropy with age at the (a) age-gain and (b) age-loss CpGs. (c) The HFD mice also showed a slight increase in entropy at CpGs that were not strongly associated with age (age-ns). (d) The methylome-wide distribution of beta-values in a young adult mouse (0.6 years old; black dashed line) and an older mouse (2.3 years old; red line); both CD mice. The young mouse has higher peaks at the hypomethylated (closer to 0.1) and hypermethylated (around 0.9) beta-values compared to the older mouse. (e) The HFD group has higher entropy at the age-gain CpGs compared to the CD group. (f) Entropy at age-loss CpGs is higher with higher baseline weight (BW0). (g) Relative effects of predictor variables on entropy shown as logworth scores (-log10p). The dashed lines correspond to p=0.01. Positive values indicate positive regression estimates (for diet, positive value means higher in HFD). BWF, final weight; Chol, serum total cholesterol; Gluc, fasted glucose levels; LS, strain median lifespan. (h) The residual plot (adjusted for age, diet, BWF, glucose, cholesterol, and batch) shows the inverse association between entropy at age-gain sites and lifespan. Similar residual plots show the association between (i) BWF and age-loss entropy, and (j) between fasted serum glucose and age-gain entropy.

