. 2022 Apr 7;11:e75244. doi: 10.7554/eLife.75244

Figure 4. Quantitative trait locus (QTL) maps for the DNAm readouts.

The Manhattan plots represent the location of genotyped markers (x-axis) and linkage –log10p (y-axis). (a) The peak QTL for age acceleration from the pan-tissue interventional clock (int.EAA) is on chromosome (Chr) 11 at ~93 Mb. The inset shows the mean (± standard error) trait values for BXDs homozygous for the C57BL/6J allele (BB; gray) versus BXDs homozygous for the DBA/2J allele (DD; black) on control diet (CD) and high-fat diet (HFD). (b) The liver-specific int.EAA has a peak QTL on Chr19 (~38 Mb). Trait means by genotype at this locus are shown in inset; BB has higher age acceleration. (c) Linkage statistics are weaker for the methylome-wide entropy. However, there is a nominally significant linkage on the Chr19 locus, but the peak markers are at ~47.5 Mb. Here, the BB genotype has higher entropy.

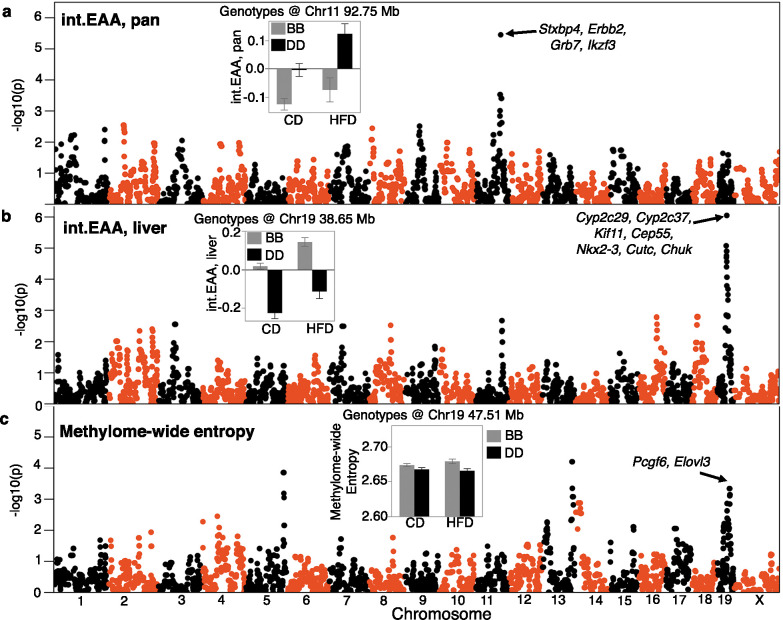
Figure 4.

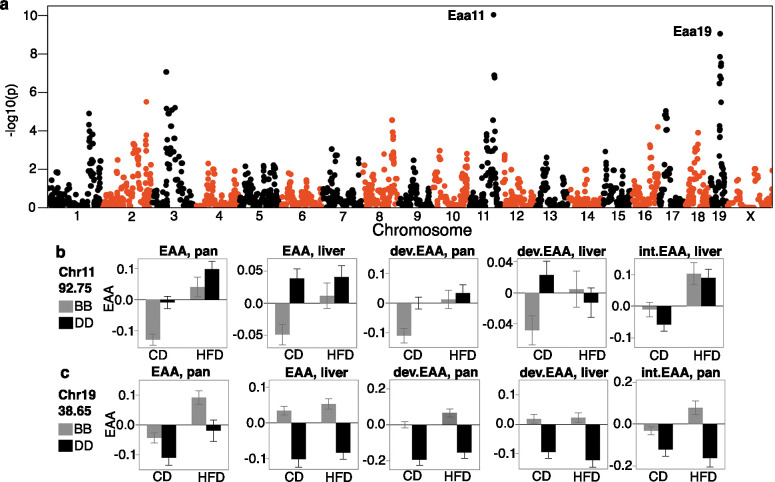
Figure 4—figure supplement 1. Consensus quantitative trait locus (QTL) mapping for epigenetic age acceleration (EAA).

Figure 4—figure supplement 1.

(a) The Manhattan plot displays the combined meta p-values for EAA. These meta p-values are based on a simple p-value combination for the six EAA traits and are mainly to highlight regions with the highest consensus QTLs. The highest peaks are on chromosomes 11 (Eaa11) and 19 (Eaa19). (b) BXDs were segregated by genotype at a representative marker in Eaa11 (variant at 92.750 Mb). In the control diet group (CD), mean EAA (± standard error) is higher for mice with the DD genotype. Only the EAA derived from the liver interventional clock (int.EAA) shows no difference between the genotypes. (c) BXDs were segregated by the genotype at a marker in Eaa19 (38.650 Mb). Mean EAA is higher in the BB genotype, and this genotype effect is seen for all the clocks in both diets.