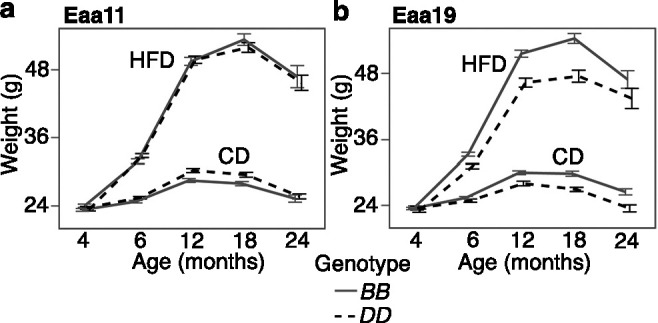
Figure 5. Body weight trajectory by diet and genotype.

Body weight was measured at regular age intervals (x-axis) from (a) 2112 BXD mice that were homozygous at the Eaa11 marker (DA0014408.4; 842 BB, 1279 DD) and (b) 1852 BXD mice that were homozygous at the proximal Eaa19 marker (rs48062674; 1252 BB, 600 DD). Mice were maintained on either control diet (CD) or high-fat diet (HFD). The graphs show the segregation of body weight over time by diet and genotype. Mean ± standard error; heterozygotes were excluded.
