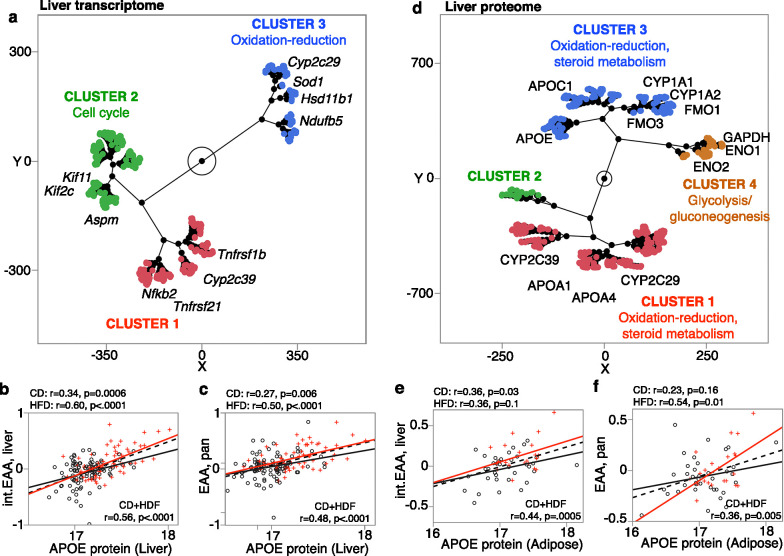
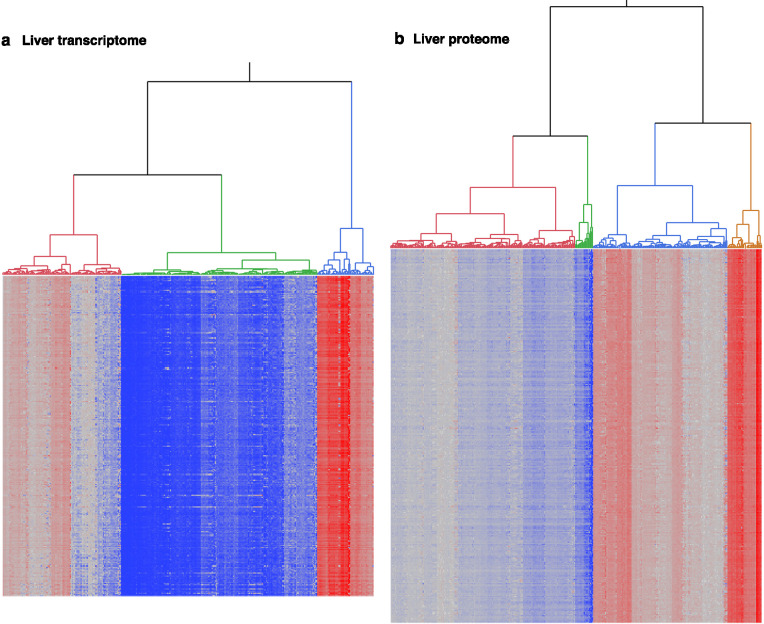
Figure 6. Gene expression correlates of epigenetic age acceleration (EAA).
(a) mRNAs that are correlated with the acceleration of both pan-tissue general clock (pan EAA) and liver interventional clock (liver int.EAA) were grouped based on unsupervised hierarchical clustering (HC). Few representative genes and gene ontologies are highlighted. For liver proteome, the level of APOE is the strongest correlate for both (b) liver int.EAA and (c) pan-tissue EAA. (d) For liver proteins that are correlated with both pan-tissue EAA and liver int.EAA, HC grouped the proteins into clusters enriched in oxidation-reduction and lipid metabolism, and a cluster enriched in glycogen metabolism. In adipose tissue, the expression level of the APOE protein is higher with higher age acceleration for both (e) liver int.EAA and (f) pan-tissue EAA.


