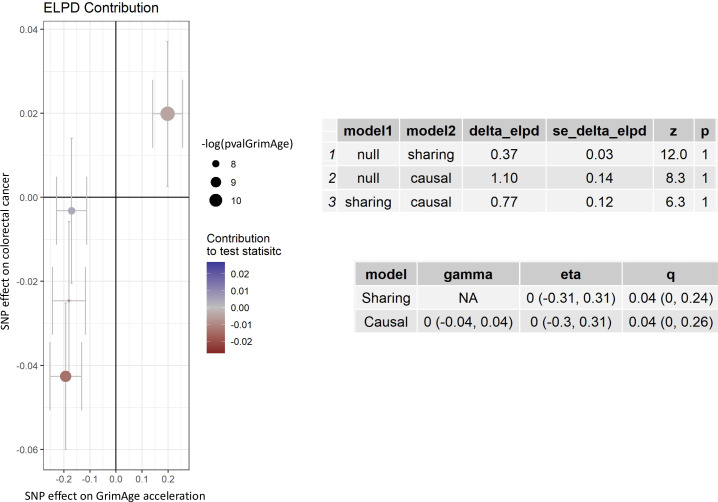
Appendix 2—figure 11. CAUSE analysis for the genetically predicted effect of GrimAge acceleration on colorectal cancer in GECCO.
CAUSE estimates for colorectal cancer reported per 1 year increase in GrimAge acceleration. The ELPD Contribution plot shows the relative contribution of each SNP to the CAUSE test statistic. Only SNPs with P < 5e-8 are shown. SNPs represented by larger circles reflect smaller p-values for the associations between genetic variants and GrimAge acceleration. SNPs that contribute more to the causal model are shown in warmer tones (i.e. red), while those that contribute more to the sharing model are shown in colder tones (i.e. blue). The delta_elpd is the statistic used to compare models. It is equal to elpd(model 1)- elpd(model 2). In the upper table, positive delta_elpd’s suggest that model one is a better fit to the data than model 2 (i.e. that the null model is better than the sharing model in row 1, that the null model is better than the causal model in row 2, and that the sharing model is better than the causal model in row 3). The corresponding p-values test whether model two is a better fit than model 1. Here, row three suggests that the causal model is not a better fit than the sharing model (the delta_elpd is positive and the p-value is 1, so there is no detectable evidence against the null hypothesis that the sharing model is better than the causal model). In the bottom table, eta represents the sharing factor effect (SNPs affect shared factor and shared factor simultaneously affects GrimAge and colorectal cancer) and gamma represents the causal factor effect (SNPs affect GrimAge and GrimAge affects colorectal cancer). Here, “0 (-0.04, 0.04)” represents the genetically predicted effect of GrimAge acceleration on colorectal cancer after adjusting for correlated and uncorrelated horizontal pleiotropy (results in log odds ratio scale). The intervals shown are credible intervals. Data source: GECCO, Genetics and Epidemiology of Colorectal Cancer Consortium.

