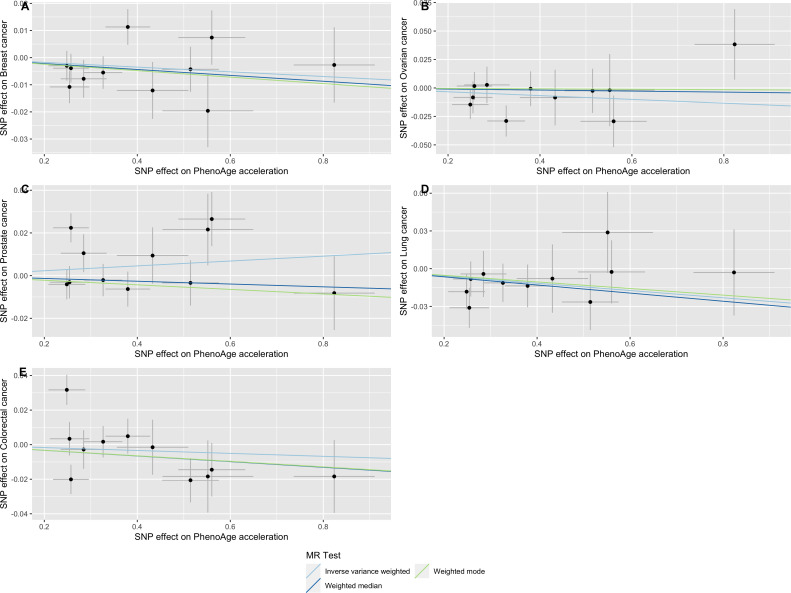
Appendix 2—figure 6. Scatter plot showing the effect of genetic instruments on PhenoAge acceleration against their effect on multiple cancer.
Genome-wide association estimates for (A) breast, (B) ovarian, (C) prostate, (D) lung and (E) colorectal cancer were meta-analysed using the METAL software. Results were obtained using inverse variance weighted MR (light blue), weighted median (dark blue) and weighted mode (light green) methods. Data sources: UK Biobank, FinnGen and international cancer genetic consortia. For colorectal cancer, UK Biobank estimates were not included in the meta-analysis to avoid double counting participants included in the GECCO consortium.

