Figure 2.

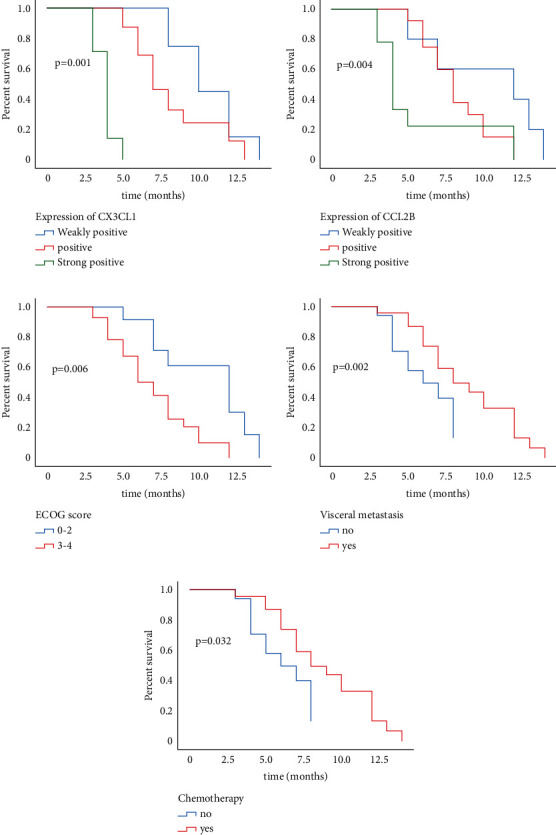
Kaplan–Meier survival analysis plotted the survival curve of variables significantly related to the prognosis of patients.

Kaplan–Meier survival analysis plotted the survival curve of variables significantly related to the prognosis of patients.