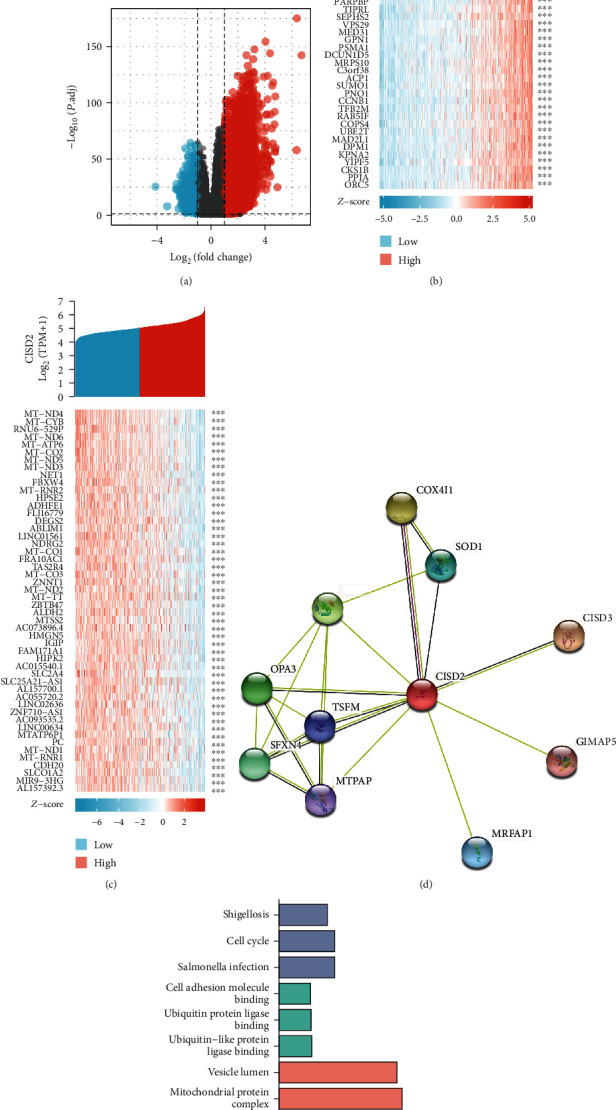
Figure 3.

CISD2 coexpression genes in glioma. (a) Correlation between CISD2 and genes differentially expressed in glioma. (b) Heat map of the 50 significant genes positively correlated with CISD2 in glioma. (c) Heat map of the 50 most significant genes negatively correlated with CISD2 in glioma. (d) CISD2-interaction proteins in glioma tissues. Annotation of CISD2-interaction proteins and their coexpression scores. (e) Significantly enriched GO annotations (CC: cellular component; BP: biological process; MF: molecular function) and KEGG pathways of CISD2 and 50 most positive coexpression genes in glioma.
