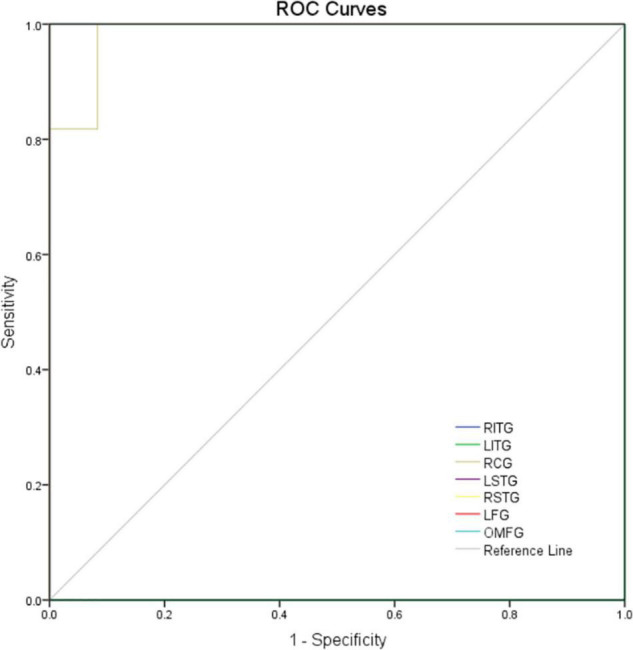
FIGURE 3.

ROC curve analysis of the mean ReHo values for altered brain regions. The area under the ROC curve were 1.000, (p<0.0001; 95% CI: 1.000–1.000) for LITG, RITG, LSTG, RSTG, LFG, and OMFG; 0.985 (p < 0.01; 95% CI: 0.946–1.000) for RCG. AUC, area under the curve; ROC, receiver operating characteristic.
