. 2020 Mar 17;10(19):11079–11087. doi: 10.1039/d0ra01128b

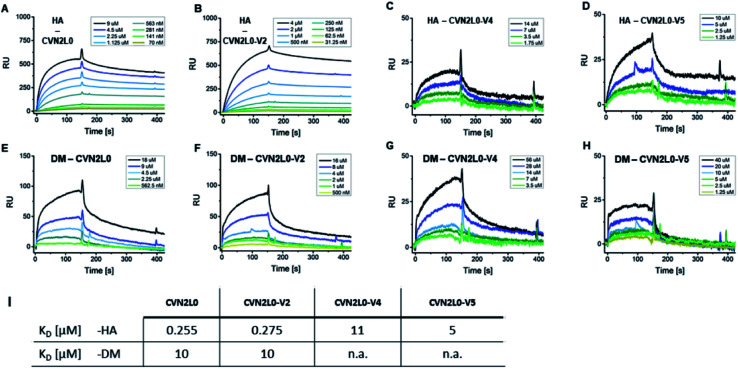
Fig. 3. CVN2L0 and variants binding to HA and DM. (A–D) SPR sensorgrams showing CVN2L0 (and variants V2, V4 and V5) binding to HA which is covalently immobilized onto a Xantec CMD500D sensorchip at 20 μg mL. (E–H) SPR binding assays of CVN2L0 and variants V2, V4 and V5 with DM under the same conditions. Scrubber (Biological Software) was used to fit real-time SPR association and dissociation curves (kon = 0.9–5 × 10⁻³ M−1s−1; koff = 1.3 × 10⁻³ s−1 for CVN2L0; koff = 1.1 × 10⁻³ s−1 for V2; koff = 1.3 × 10⁻² s−1 for V4; koff = 5.8 × 10⁻² s−1 for V5) and to calculate equilibrium dissociation constants from both kinetic and equilibrium data. The SPR dissociation rate constant koff for CVN2 binding to DM (koff = 9.2 × 10⁻³ s−1 for CVN2L0 and 1.2 × 10⁻² s−1 for CVN2L0-V2) was to the maximum 10-fold higher concerning CVN2L0-V2, if compared to the dissociation off-rates in binding to HA (Table S2). The residual response for dissociation of V4 (Cys–Cys mutagenesis to Trp–Met and Glu–Arg) from DM was still higher than 25% of the response maximum. V5 (2× Glu–Arg) failed in dissociation from surface-bound DM. (I) Values of KD = equilibrium dissociation constant. RU = Response Units. (A) Rmax = 520 RU, (B) 723 RU, (C) 34 RU, (D) 52 RU, (E) 161 RU, (F) 132 RU.

Fig. 3