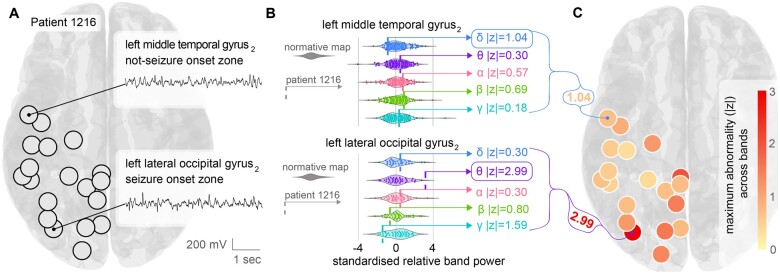
Figure 2.
Normative band power as a reference to detect abnormalities in individual patients. (A) Visualization of the regions covered by the implanted electrodes in an example patient with epilepsy. 18 of the 128 regions were sampled by the electrode contacts in this patient (black circles). Time series from two example regions are shown that are without obvious epileptiform activity (inset). One example region (left lateral occipital gyrus 2) was the seizure onset zone in this patient. (B) Relative band power for each of the two regions, across each frequency band is plotted for the normative data (coloured violin plot; each point is a normative participant). Data are standardized (mean subtracted and divided by standard deviation). Relative band power z-score for Patient 1216 is plotted as a vertical dashed line on the same scale. The z-scores indicates that the left middle temporal gyrus is normal in all frequency bands (maximum absolute z = 1.04). The left lateral occipital gyrus is more abnormal in theta (maximum absolute z = 2.99) and gamma (absolute z = 1.59). (C) Maximum absolute z-score for each region plotted for the patient. Larger values indicate greater abnormality in any frequency band.

