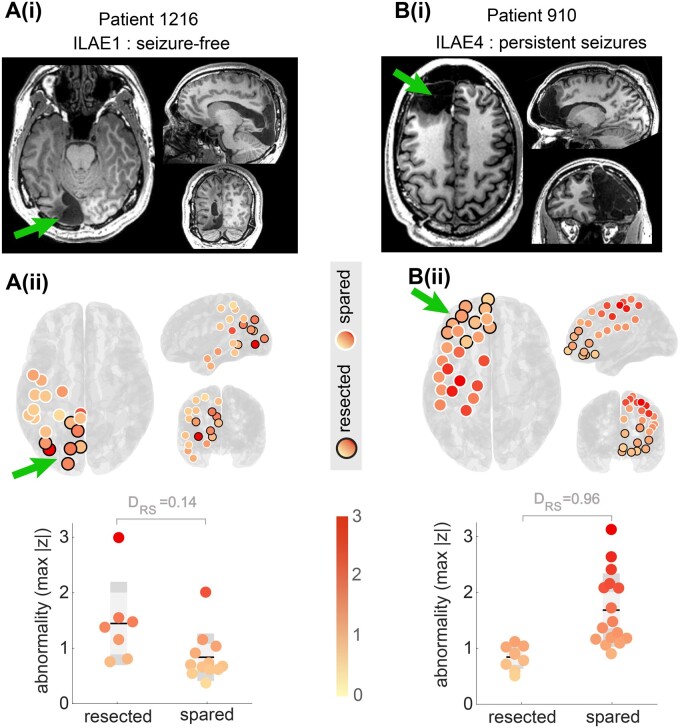
Figure 3.
Interictal band power abnormality as a marker of epileptogenic tissue in two example individual patients. [A(i) and B(i)] Postoperative T1-weighted MRI scans showing the location of the resection as indicated by the green arrow. [A(ii)] Replication of the patient in Fig. 2 with the regions that were later surgically resected circled in black. Non-resected regions are circled in white. A direct comparison and quantification in the lower panel shows resected regions to be more abnormal than spared. Each data-point is a separate region. This patient was seizure free after surgery (ILAE1). [B(ii)] Visualization of data from a second patient with a frontal lobe implantation. Multiple abnormal regions were present outside the resection and spared by surgery. This patient had had continued postoperative seizures (ILAE4). In both patients, the metric quantified the difference between resected and spared regions in terms of their abnormality.

