Figure 3.
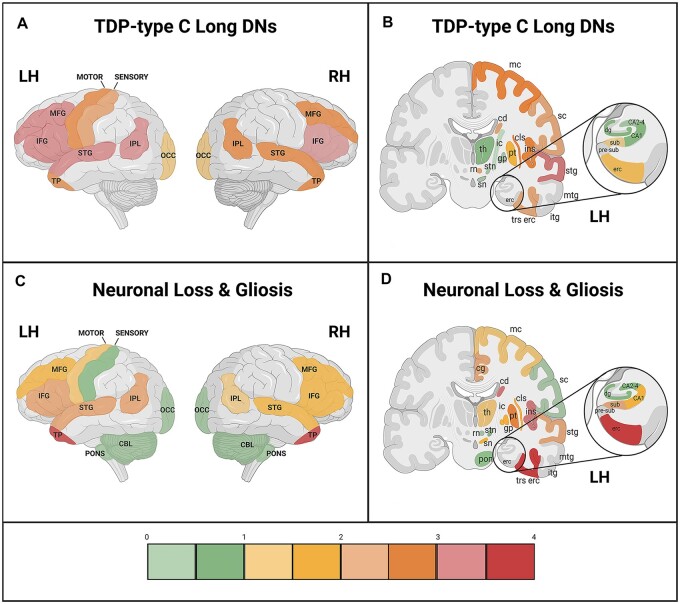
Mean cortical distribution (lateral view) and mean subcortical/cortical distribution (coronal view) of long DNs and NL/G in TDP-type C. Cortical and subcortical distribution maps depict the relationship between TDP-type C long dystrophic neurites (long DNs) and neuronal loss and gliosis at the group level (n = 10). Semiquantitative ratings for (A and B) long DNs and (C and D) NL/G in cortical regions were averaged across all 10 cases. Scale bar on the bottom shows the colour associated with mean scores. Through the anatomic depiction of long DN and NL/G distribution, we found areas that showed an inverse relationship between long DNs and NL/G that was not appreciated through standard heat maps. These areas included the right and left temporal poles, the entorhinal and transentorhinal cortices and the amygdala, which are three regions that are first affected in FTLD-TDP-type C disease progression. (A and C) CBL = cerebellum; IFG = inferior frontal gyrus; IPL = inferior parietal lobule; LH = left hemisphere; MFG = middle frontal gyrus; OCC = occipital; RH = right hemisphere; STG = superior temporal gyrus; TP = temporal pole. (B and D) cd = caudate; cg = cingulate gyrus; cls = claustrum; dg = dentate gyrus; erc = entorhinal cortex; gp = globus pallidus; ic = internal capsule; ins = insula; itg = inferior temporal gyrus; LH = left hemisphere; mc = motor cortex; mtg = middle temporal gyrus; pon = pons; pre-sub = pre-subiculum; pt = putamen; RH = hemisphere; rn = red nucleus; sc = somatosensory cortex; sn = substantia nigra; stg = superior temporal gyrus; stn = subthalamic nucleus; sub = subiculum; th = thalamus; trs erc = transentorhinal cortex. *Refer to Fig. 2 to view NL/G and long DN distribution within the amygdala. Created with BioRender.com.

