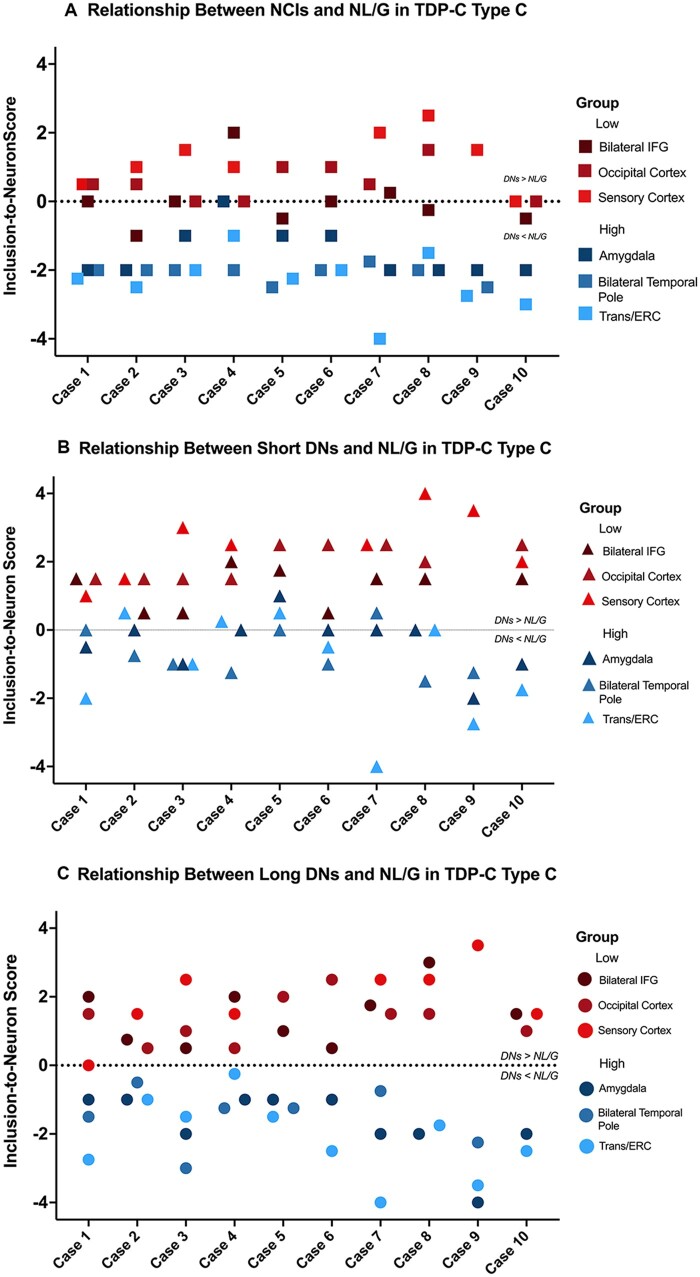
Figure 4.
Relationship between TDP-type C inclusions and NL/G at the individual case level. Neuron-to-inclusion scores were calculated for (A) NCIs, (B) short DNs and (C) long DNs in the selected regions in the high and low neuronal dropout groups, and scores from all 10 cases were plotted. When scores were available from homotypic regions in both hemispheres, such as inferior frontal gyrus (IFG) and temporal poles, scores were averaged for the individual inclusion and NL/G in the right and left hemispheres and used in the analysis and are thus notated as bilateral temporal poles and bilateral IFG. Entorhinal and transentorhinal cortices also had similar neuron-to-inclusion scores and were therefore also averaged, notated as Trans/ERC. Neuron-to-inclusion scores differed significantly between high and low neuronal dropout regions at an individual level across NCIs (P < 0.0001), short DNs (P < 0.0001) and long DNs (P < 0.0001).

