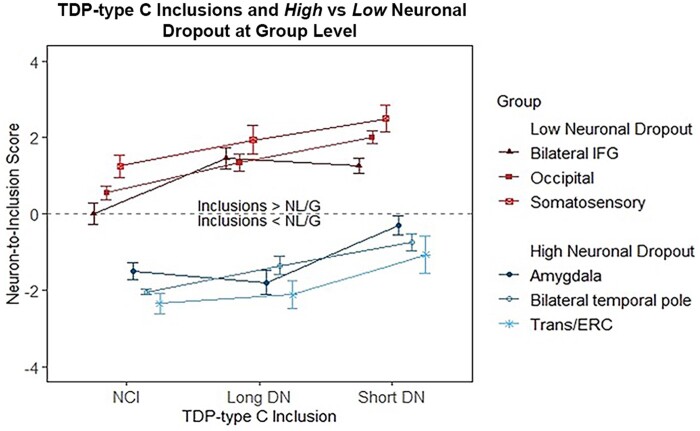
Figure 5.
Relationship between TDP-type C long DNs, short DNs and NCI in high versus low neuronal dropout at the group level. Neuron-to-inclusion scores were averaged across all 10 cases for long DNs, short DNs and NCIs in the regions designated as part of the high neuronal dropout group and low neuronal dropout group. We found that the median neuron-to-inclusion scores differed significantly (P < 0.05) between these two groups.

