Figure 2.
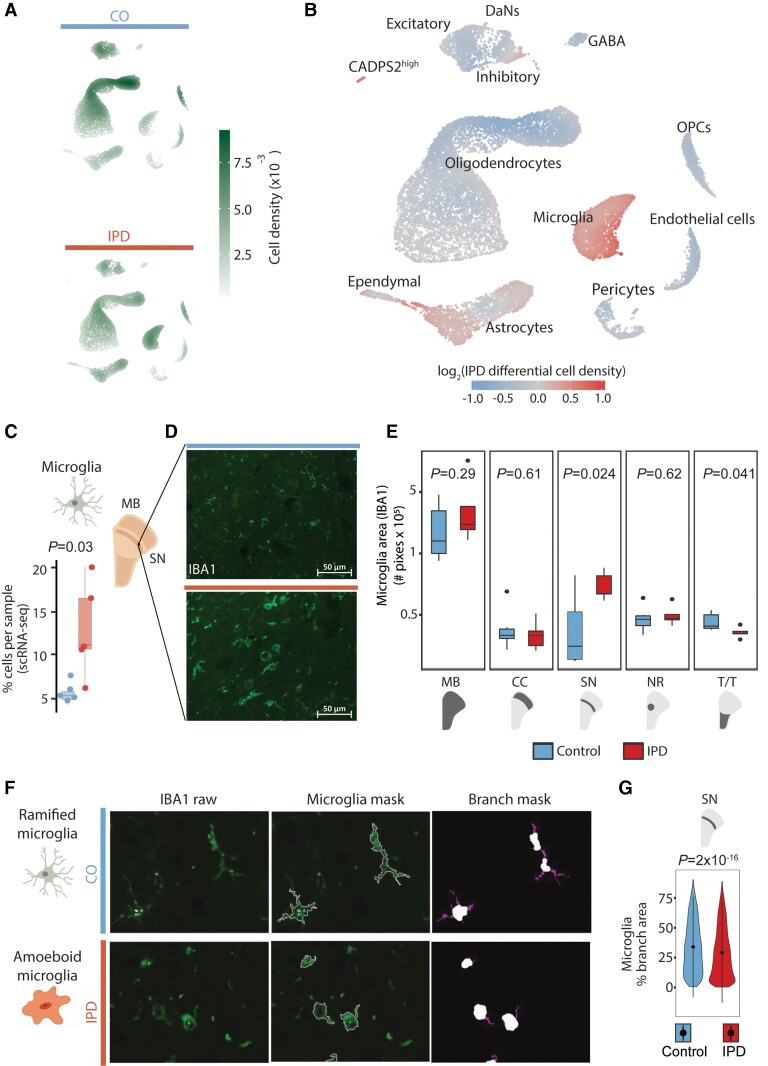
Idiopathic Parkinson’s disease (IPD) midbrain is characterized by an increase in microglia. Differential cell type composition in idiopathic Parkinson’s disease patients compared to age-matched control subjects. (A) Two-dimensional cell density in the first UMAP embeddings of the human midbrain for idiopathic Parkinson’s disease patients and control subjects independently. (B) Differential 2D cell density in idiopathic Parkinson’s disease midbrain. Idiopathic Parkinson’s disease midbrain has a larger population of microglia and astrocytes than control midbrain tissue. (C) Microglia cell proportion per sample. Idiopathic Parkinson’s disease patients display a higher proportion of microglia cells (t-test P = 0.03). (D) IBA1 immunofluorescence in idiopathic Parkinson’s disease and control ventral midbrain sections. (E) IBA1-positive areas in the entire midbrain and individual regions of 11 individuals. The Parkinson’s disease-associated increase of microglia is the most significant in the SN (t-test P = 0.024). (F) Microglia morphology analysis. (G) An idiopathic Parkinson’s disease-associated reduction of microglia branching indicates less ramified microglia in the SN (t-test P = 2 × 10⁻¹⁶), which implies increased cell reactivity. MB = midbrain; PD = Parkinson’s disease; NR = nucleus ruber; TT = tectum/tegmentum; CC = crus cerebri. IPD: red bar; control: blue bar; scale bar = 50 μm.

