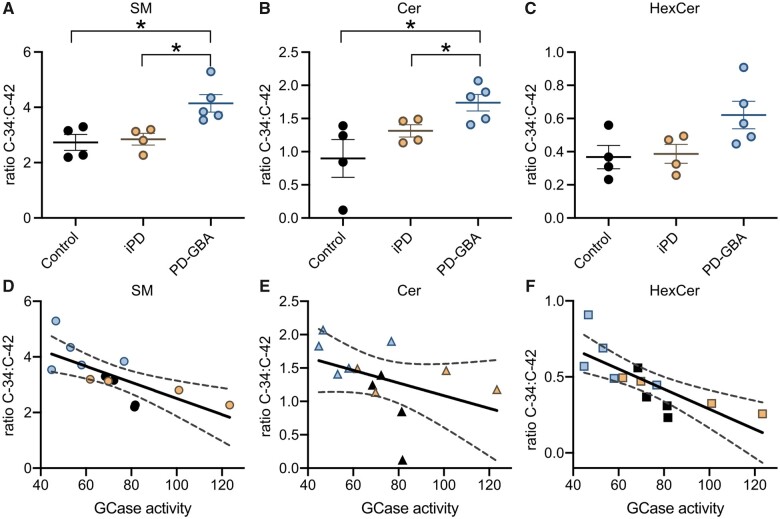
Figure 5.
Correlation between the ratio short- over long-chain sphingolipids and GCase activity. (A–C) The ratios C34:C42 (percentage C34 over percentage C42) SM, C34:C42 Cer and C34:C42 HexCer were calculated from lipid measurements made in fibroblasts from control subjects (n = 4) and idiopathic Parkinson’s disease (iPD; n = 4) and PD-GBA (n = 5) patients (one replicate per cell line). Data are shown as individual values and mean ± SEM. Unpaired t-test was performed to compare data in control subjects versus values in the idiopathic Parkinson’s disease or PD-GBA groups. Control versus PD-GBA: SM C34:C42 [P = 0.0147; F(4,3) = 1.504], Cer C34:C42 [P = 0.0221, F(3,4) = 4.173]. Idiopathic Parkinson’s disease versus PD-GBA: SM C34:C42 [P = 0.0149; F(4,3) = 2.791], Cer C34:C42 [P = 0.0352, F(4,3) = 2.246]. (D–F) C34:C42 SM, Cer and HexCer ratio values for each control (n = 4, black), idiopathic Parkinson’s disease (n = 4, orange) and PD-GBA (n = 5, blue–grey) fibroblast preparation were plotted against the corresponding values of GCase activity. Pearson correlation analysis was performed to assess the strength of the association between: C34:C42 SM ratio and GCase activity (P = 0.0053; r = −0.7226), C34:C42 Cer ratio and GCase activity (P = 0.1546; r = −0.4186) and C34:C42 HexCer ratio and GCase activity (P = 0.0020; r = −0.7729). *P < 0.05.

