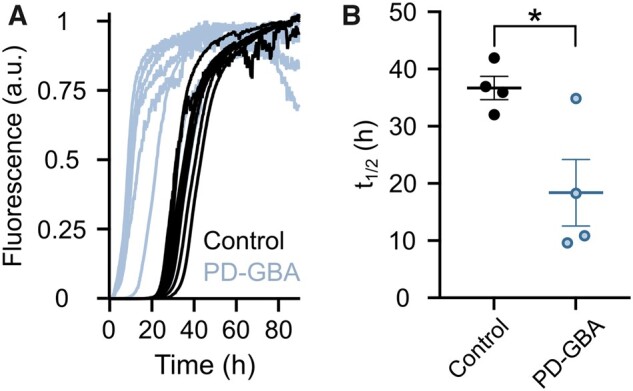
Figure 6.

Kinetics of α-syn aggregation in the presence of fibroblast lipid extracts. (A) Lipid extracts from control (n = 4; black) and PD-GBA (n = 4; blue–grey) fibroblast preparations were added to solutions of α-syn and ThT. ThT fluorescence was measured as an indicator of amyloid fibril formation. Kinetics curves are shown from two separate incubations of each subject/patient extract. (Β) Half-times of the reaction of α-syn fibril formation after addition of lipid extracts from control subjects (n = 4) and PD-GBA patients (n = 4). Each circle represents the average of duplicate measurements. Data are shown as individual values and mean ± SEM. Unpaired t-test was performed to compare data. P = 0.0248; F(3,3) = 8.102. *P < 0.05.
