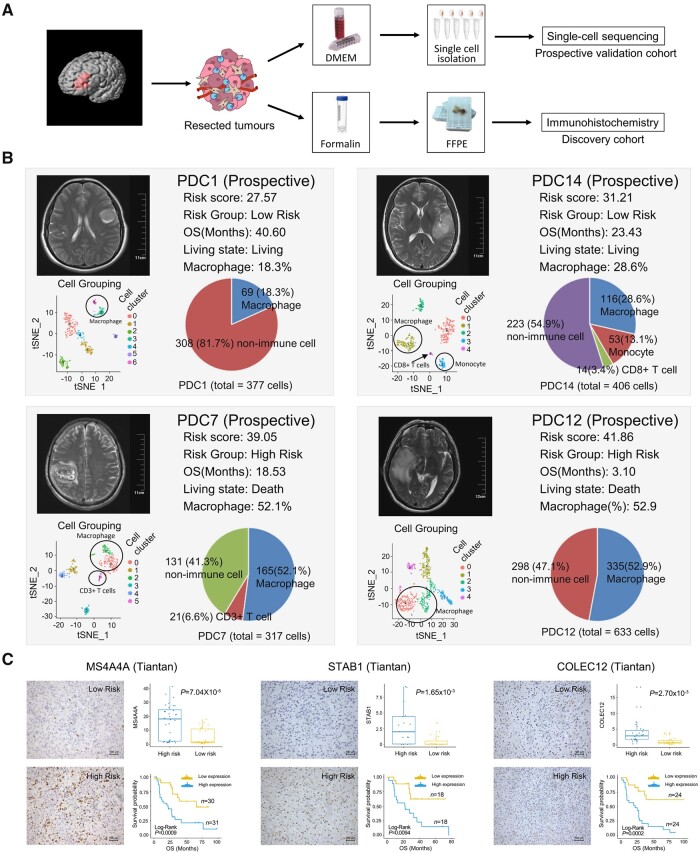
Figure 5.
Experimental validation of RF-related tumour macrophage infiltration. (A) Scheme of the experimental workflow. (B) t-Distributed stochastic neighbour embedding (tSNE) plot shows clustering of each patient’s cells based on gene expression. Point coordinates are based on tSNE dimensionality reduction of the top principal components calculated from the 5000 most informative genes. Cell colour specifies assignment of cells to these clusters inferred using shared nearest neighbour clustering. Pie charts demonstrate the distribution of the identified cell types across samples in each patient and histograms show the macrophage cell abundance between high-risk and low-risk patients. (C) Immunohistochemical staining displays the RF-related macrophage markers MS4A4A, STAB1 and COLEC12. The scatter diagram shows the expression level of these markers in high-risk and low-risk samples. Kaplan–Meier survival analysis was performed between the samples with high and low expression of macrophage markers.

