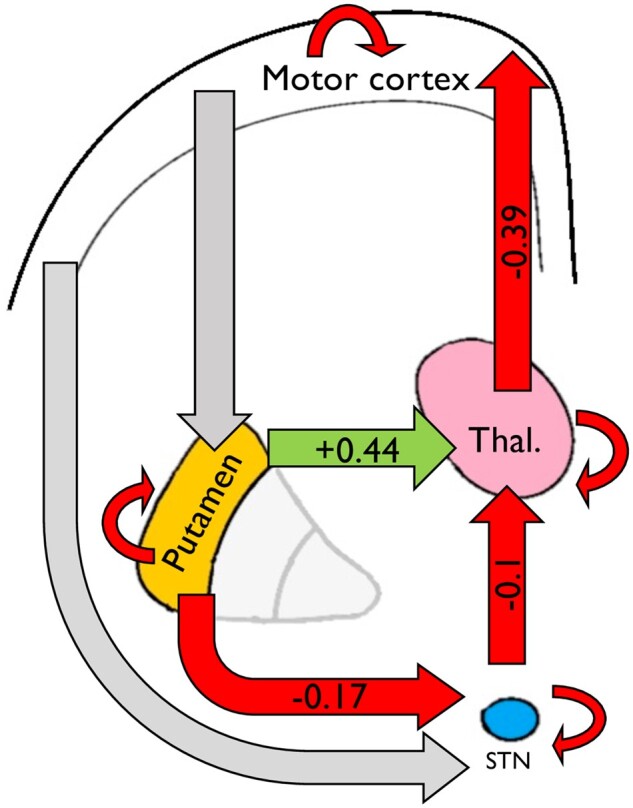
Figure 4.

Schematic showing the average parameter values in the modelled network, across all 94 Huntington’s disease subjects, for between-node connections. Red arrows indicate suppression of activity, green arrows indicate excitation and grey arrows indicate non-significant connections. Coloured arrows represent connections with a posterior probability of >0.99 for being greater than 0. Overall, the network activity shows a suppression of M1 activity, which may be expected given that subjects are explicitly trying to remain still. Negative self-connections are shown as curved arrows looping back to the node—their values are described in Supplementary Table 1. Model adapted from Kahan et al.36
