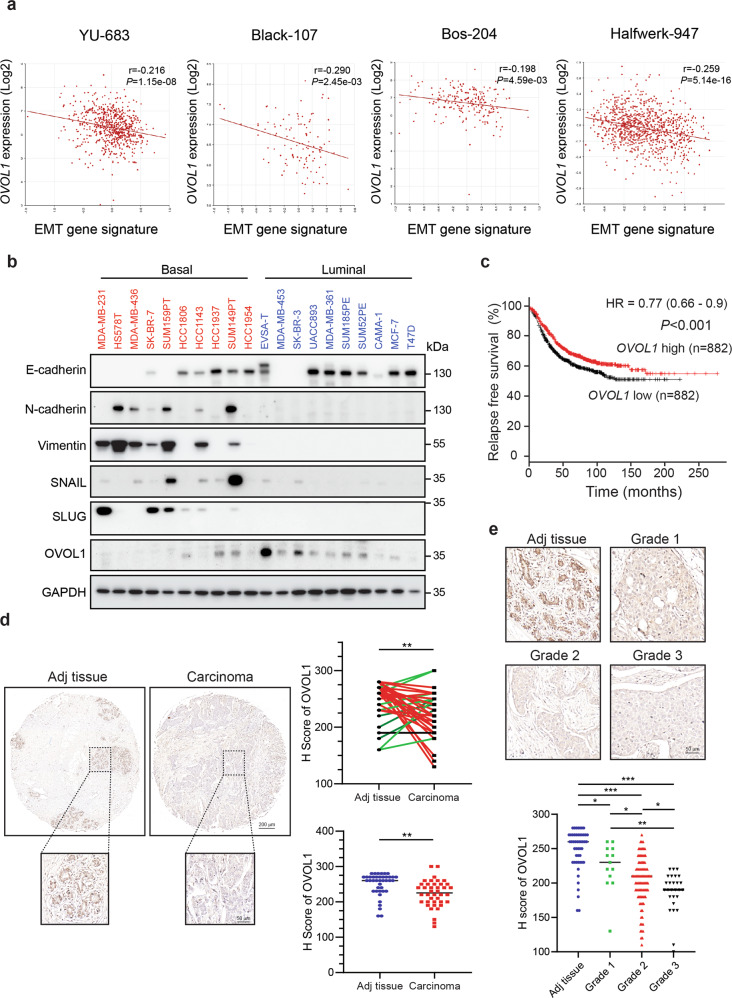
Fig. 1.
OVOL1 expression is inversely correlated with the EMT gene signature and associated with a favorable prognosis in breast cancer patients. a Scatter plot displaying the inverse correlation between OVOL1 expression and the EMT gene signature in four breast cancer datasets. Titles on top of each panel indicate the datasets in which the RNA-seq data were analyzed. Pearson’s correlation coefficient tests were performed to assess the statistical significance. b Western blotting detection of EMT markers and OVOL1 levels in ten basal and ten luminal breast cancer cell lines. GAPDH levels were analyzed to control for equal loading. c Kaplan–Meier survival curves illustrating the relapse-free survival of breast cancer patients stratified by OVOL1 expression. Data were generated from Kaplan–Meier Plotter (https://kmplot.com/analysis/). d Representative images of OVOL1 immunohistochemistry results in breast invasive ductal carcinoma (Carcinoma; n = 40) and matched cancer adjacent breast tissues (Adj tissue; n = 40) (upper). Comparisons between the H score of OVOL1 in the paired tissues (right upper) or unpaired Adj versus Carcinoma tissues (right lower) were performed. Paired tissues with higher OVOL1 expression in Adj tissues compared with Carcinoma are highlighted as red, whereas paired tissues with lower OVOL1 expression in Adj tissues compared with Carcinoma are highlighted as green. The results are expressed as mean ± SD. **0.001 < P < 0.01. e Representative images of OVOL1 immunohistochemistry staining results in breast invasive carcinoma tissues with different grades (Grade 1, n = 13; Grade 2, n = 95; Grade 3, n = 27) and cancer adjacent breast tissues (Adj tissue; n = 50) (upper). Comparison results of OVOL1 H scores in Adj tissues and different groups of carcinoma tissues are shown in the lower panel. The results are expressed as mean ± SD. *0.01 < P < 0.05, **0.001 < P < 0.01, ***0.0001 < P < 0.001

