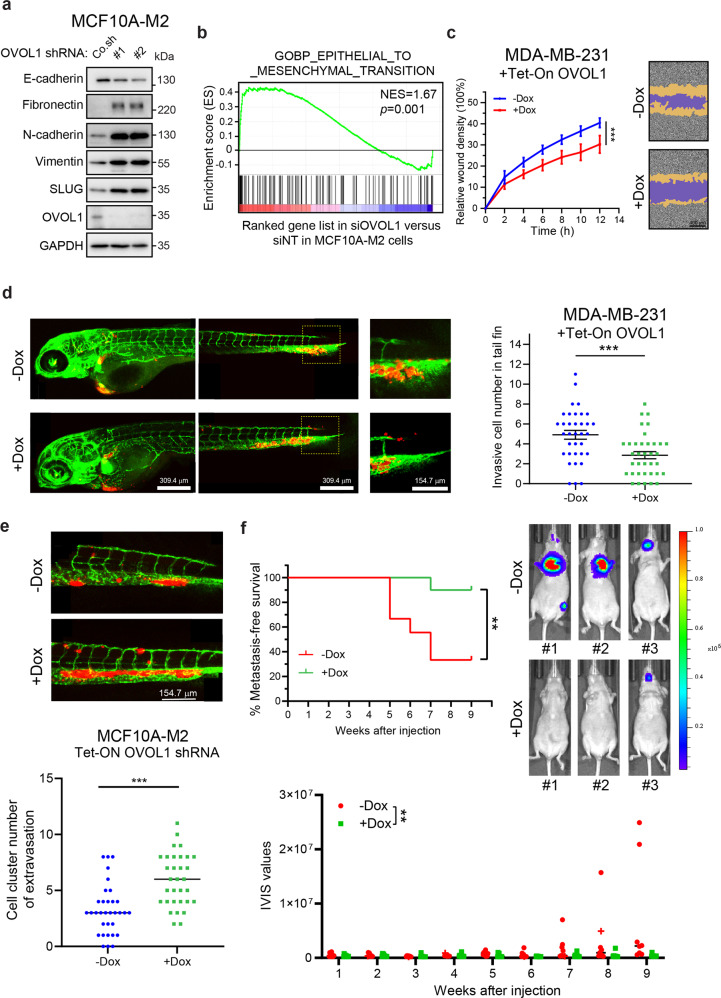
Fig. 2.
OVOL1 inhibits EMT, migration, extravasation, and early metastatic growth of breast cancer cells. a Western blotting quantification of EMT markers expression in MCF10A-M2 cells upon OVOL1 depletion. To control for equal loading, GAPDH levels were analyzed. b GSEA analysis of the positive correlation between (manipulated) OVOL1 expression and EMT gene signature. c Analysis of real-time migration of MDA-MB-231 cells in the absence or presence of OVOL1 ectopic expression. Cells were either not treated or treated with Doxycycline (Dox) for 2 days prior to seeding. Relative wound density (closure) was plotted at indicated time points (left). Representative scratch wounds are shown at the end time point of the experiment (right). The regions of original scratches and the areas of migrating cells are colored in purple and yellow, respectively. Five biological replicates were included in this assay. The results are expressed as mean ± SD. ***0.0001 < P < 0.001. d In vivo zebrafish extravasation experiments of MDA-MB-231 cells without or with ectopic expression of OVOL1. MQ water or Dox (to enable induction of OVOL1 expression) was added to egg water from the first day post injection. Representative images with zoom-in of the tail fin area are shown in the left panel. Analysis of the extravasated cell numbers in indicated groups is shown in the right panel. The results are expressed as mean ± SD. ***0.0001 < P < 0.001. e In vivo zebrafish extravasation experiments of MCF10A-M2 cells without or with the knockdown of OVOL1. MQ water or Dox (to enable the induction of the shRNA targeting OVOL1) was added to the egg water from the first day post injection. Representative images are shown in the upper panel. Analysis of the extravasated cell clusters in indicated groups is shown in the lower panel. The results are expressed as mean ± SD. ***0.0001 < P < 0.001. f Mouse xenograft cancer model of MDA-MB-231 cells without or with OVOL1 ectopic expression. MQ water or Dox (to enable induction of OVOL1 overexpression) was added to the drinking water from the first day post injection. Metastasis-free survival is depicted in the upper left panel. Log-rank test was used for statistical analysis. **0.001 < P < 0.01. Whole-body bioluminescence images (BLI) at 9 weeks of mice are shown in the upper right panel. Analysis of the IVIS values in indicated groups is shown in the lower panel. One mouse in the -Dox group that was terminated at 8 weeks after injection is indicated as a cross (and not taken along in statistical analysis of BLI measurements). The results are expressed as mean ± SD. Two-way ANOVA was used for statistical analysis. **0.001 < P < 0.01

