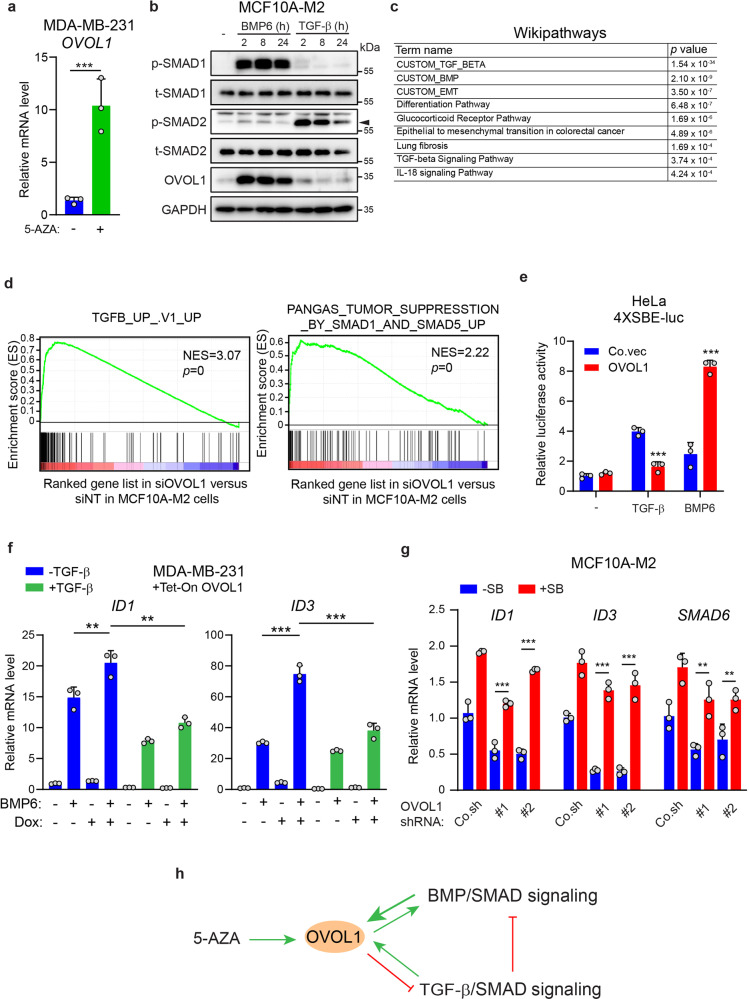
Fig. 3.
OVOL1 potentiates BMP pathway through mitigating TGF-β signaling. a RT-qPCR assay of OVOL1 expression in MDA-MB-231 cells stimulated without or with 5-Aza-2ʹ-Deoxycytidine (5-AZA) for 7 days. The results are expressed as mean ± SD. ***0.0001 < P < 0.001. b Western blotting detection of OVOL1 expression in MCF10A-M2 cells treated with TGF-β (5 ng/ml) or BMP6 (50 ng/ml) for indicated time points. The phosphorylation of SMAD1 (p-SMAD1) or SMAD2 (p-SMAD2) was detected to confirm the activation of BMP or TGF-β pathway, respectively. To control for equal loading GAPDH levels were analyzed. c The pathway enrichment results from wikipathways upon the depletion of OVOL1 in MCF10A-M2 cells. d GSEA analyses of the positive and inverse correlations between (manipulated) OVOL1 expression level and the TGF-β or SMAD1/5 (BMP) gene response signature, respectively. e Quantification of the luciferase transcriptional activity in HeLa cells transfected with TGF-β/BMP/SMAD-responsive SBE4-luc reporter and empty vector (Co.vec) or OVOL1. The results are expressed as mean ± SD. ***0.0001 < P < 0.001. f Detection of ID1 and ID3 expression via RT-qPCR in MDA-MB-231 cells with OVOL1 expression induced by Doxycycline (Dox). Cells were treated without or with TGF-β (5 ng/ml) for 1 day followed by Dox stimulation for 2 days. Afterward, cells were serum-starved overnight and stimulated without or with BMP6 (50 ng/ml) for 2 h. The results are expressed as mean ± SD. **0.001 < P < 0.01, ***0.0001 < P < 0.001. g RT-qPCR quantification of ID1, ID3, and SMAD6 levels in MDA-MB-231 cells with the inducible expression of OVOL1. Cells were either not treated or treated with SB431542 (SB) for 1 day followed by transduction of empty vector control (Co.sh) or shRNAs targeting OVOL1. The results are expressed as mean ± SD. **0.001 < P < 0.01, ***0.0001 < P < 0.001. h Schematic model illustrating the interplay of BMP and TGF-β pathways with OVOL1

