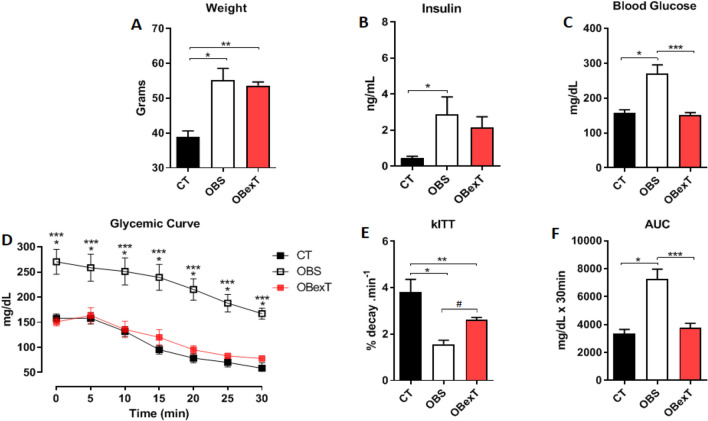
Figure 1.
Effects of obesity and strength training on (A) Body weight, (B) Fasting insulin (8 h), (C) Fasting blood glucose (8 h), (D) Glycemic curve, (E) kITT and (F) AUC. The signal of statistical difference are represented as follows *p < 0.05 CT versus OBS, **p < 0.05 CT versus OBexT and ***p < 0.05 OBS versus OBexT, #p = 0.054 (n = 4 CT group; n = 5 OBS group; n = 5 OBexT group). Anova one-way statistical analysis was used, (Glycemic curve used Anova two-way) followed by Tukey’s post-test.

