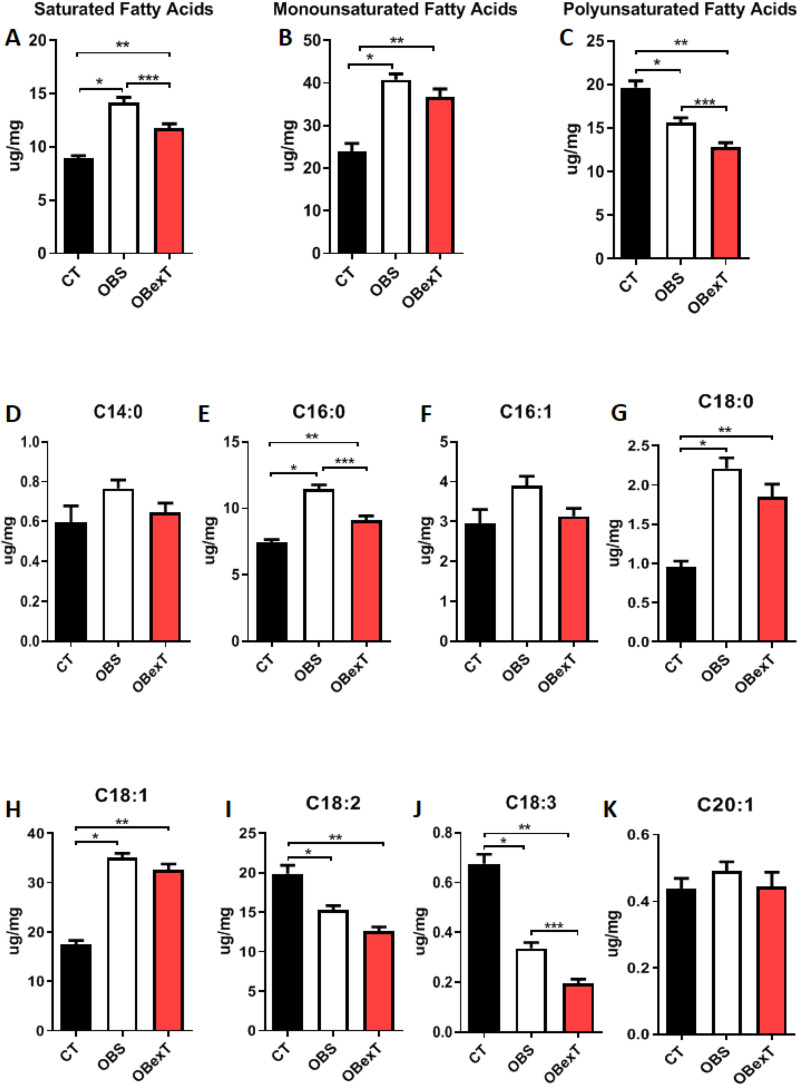
Figure 3.
Subcutaneous adipose tissue fatty acids profile. (A) Total saturated fatty acids, (B) Total monounsaturated fatty acids, (C) Total polyunsaturated fatty acids, (D) Myristic fatty acids (C14:0), (E) Palmitic fatty acids (C16:0), (F) Palmitoleic fatty acids (C16:1), (G) Stearic fatty acids (C18:0), (H) Oleic fatty acids (C18:1), (I) Linoleic fatty acids (C18:2), (J) α-Linolenic fatty acids (C18:3) and (K) Eicosanoic fatty acids (C20:1). The signal of statistical difference are represented as follows indicated, *p < 0.05 CT versus OBS, **p < 0.05 CT versus OBexT and ***p < 0.05 OBS versus OBexT (n = 5 CT group; n = 6 OBS group; n = 6 OBexT group). One-way Anova statistical analysis was used, followed by Bonferroni post-test.

