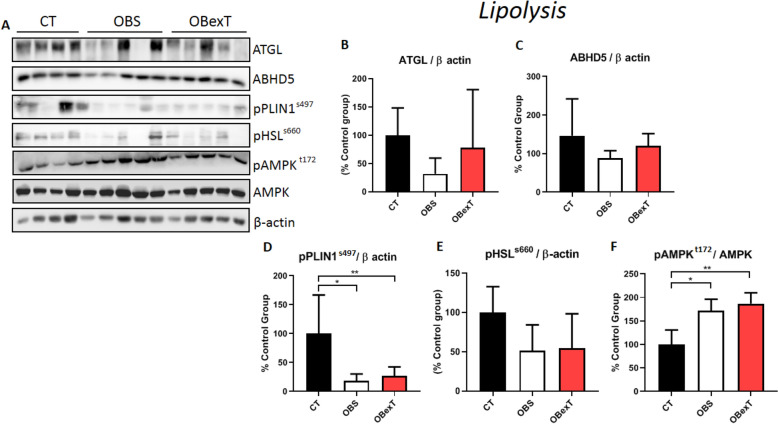
Figure 4.
Total protein extract obtained from the subcutaneous adipose tissue was used for Western Blotting experiments. Uncut images can be viewed in the supplementary material. The membranes were cut at the specific height of the target protein. (A) The protein content of (B) ATGL, (C) ABHD5, (D) pPLIN1ser497, (E) pHSLs660 and (F) pAMPKt172. The signal of statistical difference are represented as follows, *p < 0.05 CT versus OBS, **p < 0.05 CT versus OBexT and ***p < 0.05 OBS versus OBexT (n = 4 CT group; n = 5 OBS group; n = 5 OBexT group). One-way Anova statistical analysis was used, followed by Tukey's post-test.

